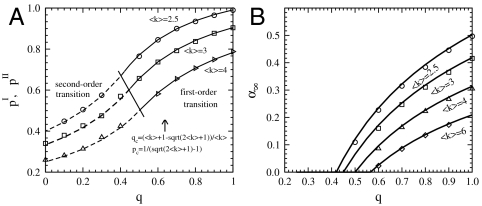
Fig. 4.
(A) Theory (lines) and simulations (symbols) are compared for the values of pI(q) and pII(q) for ER networks with different values of 〈k〉. For q > qc, the network undergoes a first-order transition, therefore the theoretical values of the transition point, pI(q), that are calculated according to Eq. 3 are compared with simulations performed using the NOI method (explained in text). For q < qc, the network undergoes a second-order transition, therefore the theoretical values of the transition point, pII(q), that are calculated according to Eq. 4 are compared with simulations performed using the second largest cluster method (explained in text). The line separating between the first and second order is obtained according to Eq. 5. (B) Comparison between simulation (symbols) and theory (lines) for α∞ as a function q for different values of 〈k〉. At the phase transition point, α∞ is finite for a first-order transition and a zero fraction for a second-order transition.

