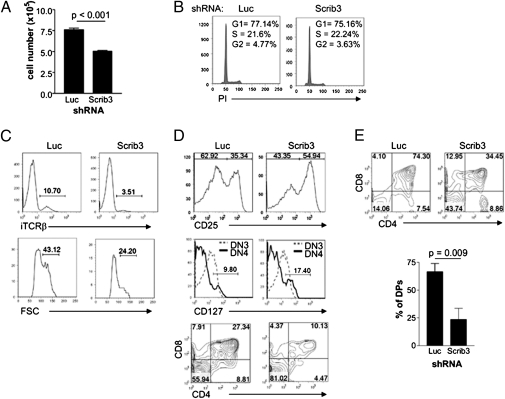
Fig. 2.
Depletion of Scribble gene expression delays the DN3–DP transition. (A) FACS-sorted late DN3 (CD44lo/−CD25+) cells were cultured for 6 d. A representative histogram of culture cellularity is shown. Data represent the mean ± SEM of cultures grown in triplicate, repeated in at least three independent experiments. (B) FACS-sorted late DN3 cells cultured for an additional 3 d were analyzed for cellular DNA content by propidium iodide staining. (C) Histograms of iTCRβ in late DN3 cells, along with an analysis of forward scatter of the corresponding iTCRβ+ late DN3 cells. The histograms are gated on GFP+CD44lo/−CD25+ cells and are representative of at least five independent experiments. (D) Phenotyping of FACS-sorted late DN3 cells after 6 d of coculture. Expression of CD25 was examined on GFP+CD44lo/− cells, CD127 expression was examined on both DN3 and DN4 cells, and finally CD4+CD8+ coexpression among GFP+CD45+ cells was determined. Contour plots and histograms are representative of eight independent experiments. (E) Representative CD4/8 FACS profiles, gated on GFP+ cells, of individual 2-deoxyguanosine–treated thymic lobes reconstituted with Luc KD or Scrib3 KD FTs. A graphic representation of the percentage of DP cells among GFP+ cells in four or five individual thymic lobes within one experiment is shown. Data are representative of three independent experiments. All numbers within FACS profiles correspond to the percentage of cells within each gate, quadrant, or region.

