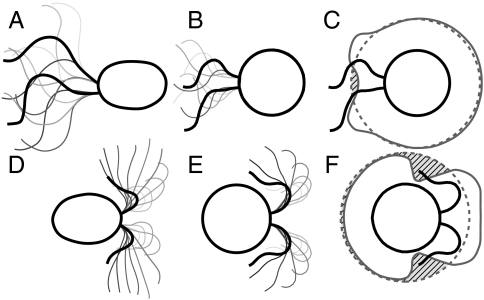
Fig. 3.
Comparison between the computed optimal strokes and strokes recorded experimentally. A–C correspond to the undulatory stroke and D–F to the breaststroke. A and D represent snapshots of stroke patterns recorded experimentally and are reproduced from refs. 10 and 12. B and E correspond to snapshots of optimal stroke patterns computed using our procedure. C and F represent the deformation induced on a closed material line by the undulatory and breaststroke, respectively. The gray dashed line is the circular closed material line of radius 2R at the beginning of the stroke and the gray solid line is the corresponding deformed material line at the end of the stroke. The shaded area A corresponds to material points dragged closer to the cell surface during the stroke.

