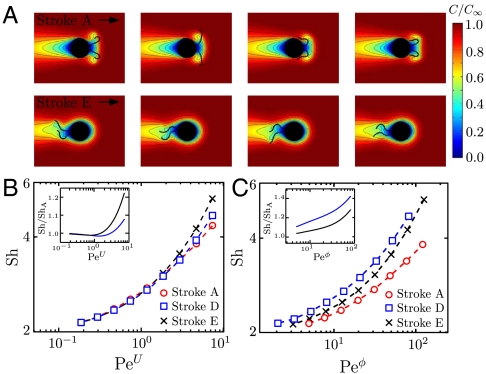
Fig. 4.
(A) Snapshots of the nutrient concentration fields around a model swimmer for PeU = 7 at successive times computed by solving Eq. 4 numerically. The top row corresponds to the undulatory stroke A, which we computed as a local optimal for  and the bottom row to the breaststroke E, which is the optimal stroke found for
  . (B) Loglog plot of Sh versus PeU = 7. The inset corresponds to a semilogarithmic plot of the ratio of Sh computed for stroke D and E divided by Sh for stroke A as a function of PeU = 7. (C) Loglog plot of Sh versus Peϕ. The inset corresponds to a semilog plot of Sh/ShA versus Peϕ.

