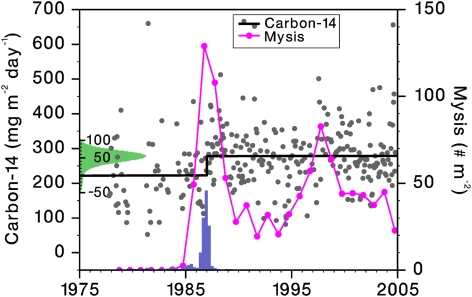
Fig. 5.
Step increase in primary production caused by mysid-mediated CTI. Time series of September Mysis abundance (magenta) and deseasonalized, light-corrected PP (gray dots) for the entire period of record, with regression line (black) from respective posterior modes of the Bayesian change point analysis fitting two independent lines with one step between them. Main y axis PP scale preserves the original long-term mean. x axis histogram shows the posterior distribution for the time (date) position of the step. y axis (rotated) histogram shows the posterior distribution for the height of the step above the beginning of the step. The y axis scale labeling for the y axis histogram (secondary scale) is in the same units as the main PP y axis, but with the origin moved to line up with the bottom of the step.

