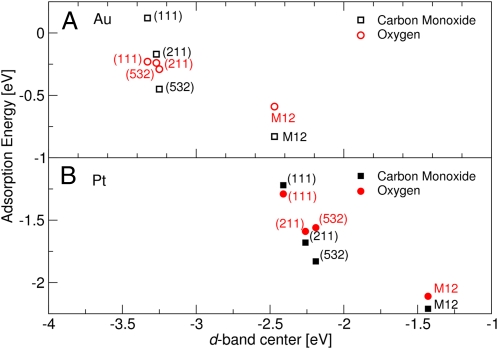
Fig. 4.
Illustration of the extent of the d-band model. Calculated CO and O adsorption energies for a range of different Au (A) and Pt (B) surfaces including 12 atom clusters are seen to correlate with the calculated d-band center (εd). Adapted from ref. 37.

