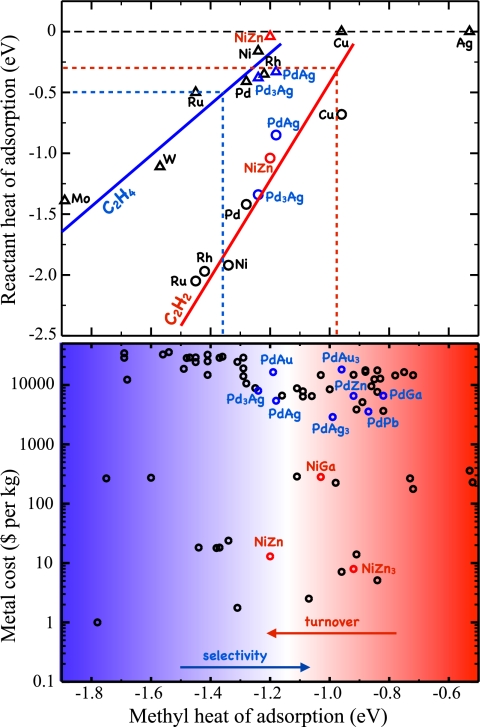
Fig. 9.
(Upper) Adsorption energy for acetylene and ethylene plotted against the adsorption energy of a methyl group. The solid lines show the predicted acetylene (red) and ethylene (blue) adsorption energies from scaling. The dotted lines define the region of interest, where the ethylene adsorption energy is less than the barrier for further hydrogenation (blue) and where the reactivity of the acetylene hydrogenation step is estimated to be 1 s−1 per site (red). (Lower) Cost (in 2006 metal prices) of 70 binary intermetallic compounds plotted against the calculated methyl adsorption energies. The smooth transition between regions of low and high selectivity (blue) and high and low reactivity (red) is indicated. Adapted from ref. 59.

