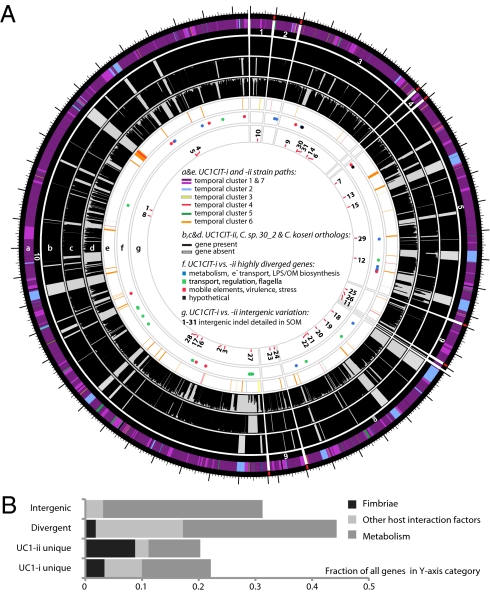
Fig. 4.
(A) Citrobacter UC1CIT genomic overview. A larger version of this figure is included as Fig. S9. (a) Outside circle represents the ten contigs of the UC1CIT-i genome. Coloring indicates read temporal distribution clusters of the contigs condensed during curation. Genes unique to UC1CIT-i are generally located in areas colored in blue (Fig. S2 cluster 2, Table S11 in Dataset S2). (b) Orthologs to UC1CIT-i in UC1CIT-ii. (c and d) Orthologs to UC1CIT-i in Citrobacter sp. 30_2 and C. koseri. (e) UC1CIT-ii paths with gene content not shared by UC1CIT-i, colored based on read temporal distribution clusters (Table S12 in Dataset S2). (f) Highly divergent genes between the UC1CIT strains, colored by functional class. (Tables S6 and S10 in Dataset S2). (g) Intergenic regions marked by indels that differentiate the UC1CIT strains (Table S9 in Dataset S2). (B) Summary of genomic differences between the UC1CIT strains.

