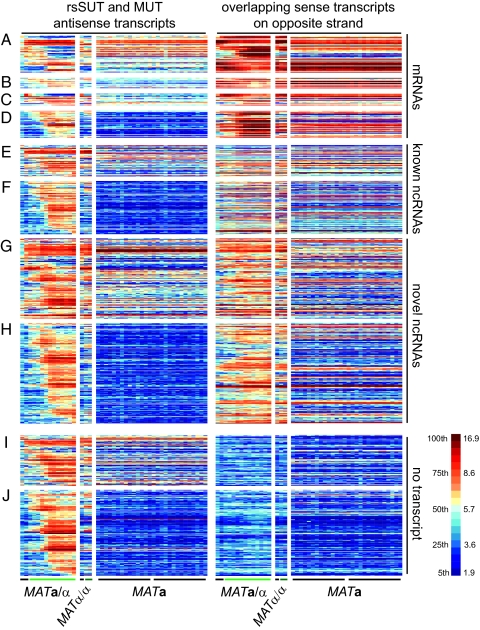
Fig. 1.
Global expression profile of differentially expressed ncRNAs. Each line corresponds to an annotated segment, and each column represents the averaged values (computed for each segment) observed in duplicate samples. (A) Antisense rsSUTs or (B) MUTs and differentially expressed sense mRNAs showing opposed expression patterns. (C) rsSUTs or (D) MUTs and differentially expressed antisense mRNAs showing similar patterns. (E and F) Sense/antisense pairs of rsSUTs and MUTs and known ncRNAs. (G and H) Sense/antisense pairs of rsSUTs and MUTs. (I and J) rsSUTs or MUTs not overlapping with any transcript. MATa/α cells were cultured in YPD, YPA (black bar), and sporulation medium (SPII, hourly samples from 1 to 12 h; light green bar). The MATα/α strain was incubated in YPA (black bar) and SPII (6 and 10 h; dark green bar). MATa cells were grown in rich medium (YPD, samples were taken every 5 min from 0 to 135 min covering two cycles; black bars). Right: Scale for log2-transformed values, containing 20 colors corresponding to increments of 5 percentiles each.

