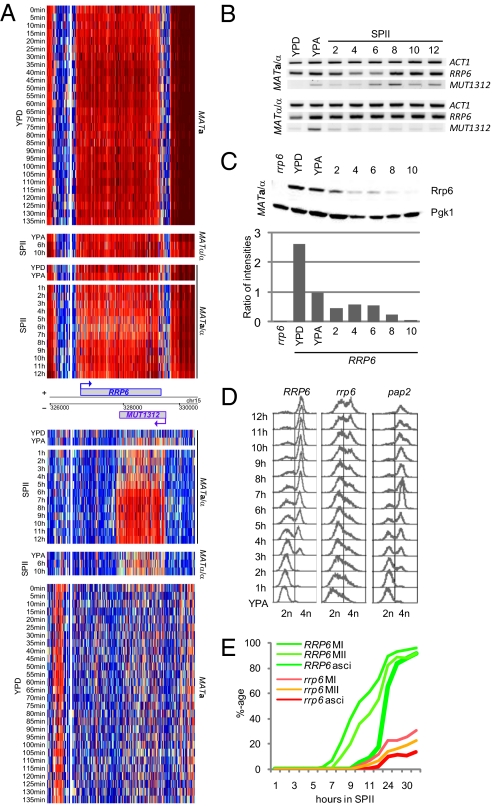
Fig. 4.
Rrp6 regulation and function. (A) Genomic heatmap of expression data for RRP6/MUT1312 from strains and samples as given. The layout is as in Fig. 2, and the scale is as in Fig. 1. (B) RT-PCR expression data for RRP6/MUT1312 using samples as in Fig. 3B. (C) Western blot data for Rrp6 and Pgk1 detected in extracts prepared from a diploid rrp6 mutant (rrp6) and diploid growing (YPD, YPA) and sporulating wild-type cells (time points taken every 2 h from 2 to 10 h). Histogram below the bands shows relative Rrp6 protein amounts on the y-axis detected in the samples given on the x-axis. (D) DNA replication dynamics analyzed by fluorescence-activated cell sorting in diploid strains containing wild-type (RRP6) and mutant (rrp6, pap2) alleles. Respiring cells (YPA) were compared with hourly samples from sporulating cells (SPII, 1–12 h). DNA content is given at the bottom. (E) Wild-type (RRP6) and mutant (rrp6) strains undergoing MI, MI+II, and ascus formation. The x-axis shows the time of incubation in SPII sporulation medium in hours, and the y-axis displays the percentage of cells within the population that have completed landmark events. The average of three independent sporulation assays is shown.

