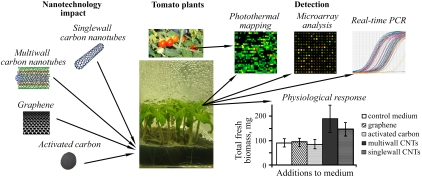
Fig. 1.
Schematics of integrated genomic and photothermal-based analysis of nanoparticle-plant interaction. The right bottom shows the effect of carbon materials (activated carbon, few-layer graphene structures, and single- and multiwall CNTs) on biomass accumulation of tomato plants. Pseudocolor in example of photothermal leaf map on right top indicates signals from small CNT clusters (red- maximum signal, green low signals).

