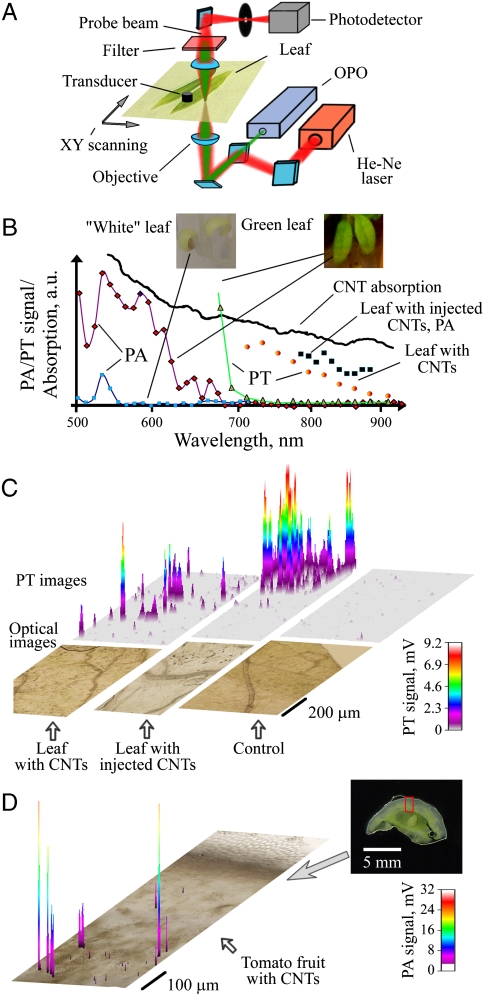
Fig. 2.
Photothermal and photoacoustic detection of multiwall CNTs in tomato leaves. Schematic of integrated PA/PT scanning cytometer (A). Spectral PA and PT identification of CNTs (B); given are images of tomato leaves grown in darkness (white) and under light (green). Two-dimensional PT maps (with three-dimensional simulation) of CNT distribution in tomato leaves compared to conventional optical images (C). Calibration model was constructed by injection of CNTs into leaf. PA detection of CNTs in 1 mm thick section of tomato fruit (D).

