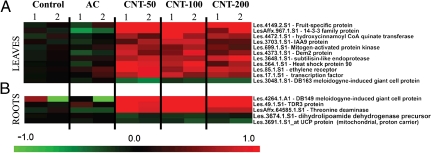
Fig. 3.
Microarray data of transcripts showing significant quantitative differences between the tomato seedlings exposed to CNTs in concentrations of 50; 100; and 200 μg/mL and two groups of control seedlings (exposed to activated carbon and unexposed to any carbon material) in two tissues of 10-day-old plants [roots (A) and first two leaves (B)]. Statistical analysis was performed by T-test (P < 10-3) based on log (2) fold changes of mRNA abundance over the average abundance of the specific transcript in the seedlings not exposed to carbon material. Only genes with known functions are presented here.

