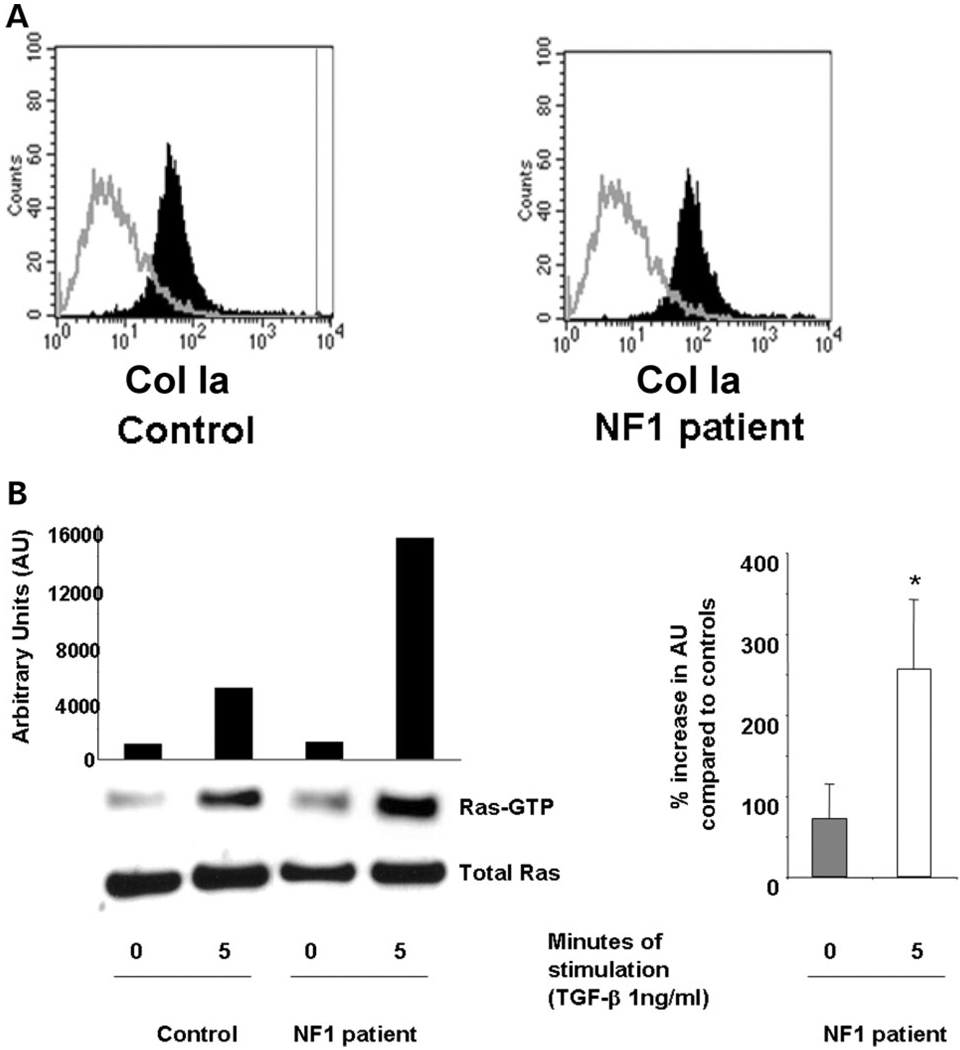
Figure 4.
Evaluation of TGF-β-mediated Ras activity and collagen synthesis in fibroblasts from neurofibromas. (A) Fibroblasts from cutaneous neurofibromas and fibroblasts from normal volunteers were examined using an antibody to the surface antigen of Col Ia by using fluorescence cytometry. The population indicated by solid bars represents Col Ia-positive cells and the population indicated by open bars indicates the fluorescence in cells following staining with an isotype control antibody. (B) Ras activity in NF1 and control fibroblasts was examined at basal levels and 5 min following TGF-β stimulation. A representative experiment (left panel) and the mean data from four independent experiments (right panel) are indicated. *P < 0.001 comparing Ras-GTP activity in NF1 patients with unaffected controls using the Student’s t-test. (C) Fibroblasts from NF1 patients or healthy controls were transduced and collagen synthesis was measured following a 24 h stimulation with TGF-β. Results represent the mean ± SEM of three replicates from one of four independent experiments with similar results. *P < 0.01 comparing proline incorporation of NF1 Pac transduced cells with control Pac transduced fibroblasts. **P < 0.01 comparing proline incorporation of NF1 GRD transduced fibroblasts with NF1 pac and NF1 1276 transduced fibroblasts using the Student’s t-test. (D) NF1 fibroblasts were transduced with the indicated constructs and wound healing assays were performed following stimulation with TGF-β. Left panel: results represent the mean ± SEM of three replicate dishes from one of four independent experiments with similar results. *P < 0.05 comparing the number of unaffected control or NF1 fibroblasts that migrate in response to TGF-β versus vehicle. **P < 0.01 comparing migration of NF1 pac transduced fibroblasts with Pac control fibroblasts using the Student’s t-test. ***P < 0.01 comparing the migration of NF1 GRD transduced fibroblasts with NF1 pac or NF1 1276 transduced fibroblasts using the Student’s t-test. Right panel: summary of the relative TGF-β-mediated migration of human NF1 fibroblasts expressing NF1 GAP sequences from four independent experiments.


