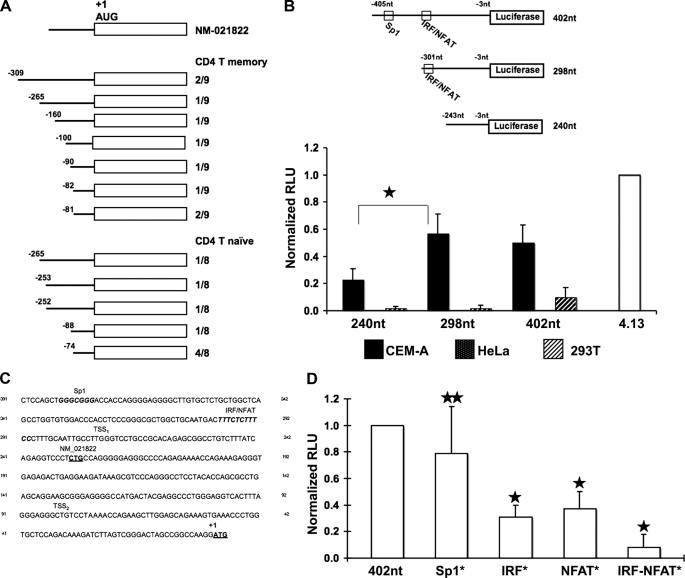
FIGURE 1.
Delineation and analysis of the A3G minimal promoter. A, 5′ RACE was performed using RNA isolated from CD4+ T cell naïve and memory subsets, and 17 individual clones were analyzed. NM_021822 represents a previously defined TSS. The TSSs recorded are tabulated. The AUG start codon is indicated. B, the upper schematic depicts the luciferase reporter constructs with numbering relative to the initiating ATG, and the construct length shown. Highlighted are a previously described Sp1 binding site and a putative composite IRF/NFAT binding site that was delineated via TRANSFAC® analysis (see C below). Luciferase activity was measured for each construct in CEM-A (black bars), HeLa (speckled bars), and 293T (hatched bars). The activity of each construct was normalized against the 4.13 SV40-luciferase positive control (normalized relative light units), M p value<0.00001. C, TRANSFAC® analysis of the region upstream of the translation start site revealed several putative transcription factor binding sites including a predicted IRF/NFAT composite site (consensus IRF binding site, TTTCNNTT; consensus NFAT binding site, TTTCC). The previously reported Sp1 site (29) is shown for comparison. The TSS1 and TSS2 clusters defined by RACE in A are indicated, as is the previously reported transcription start site (NM_021822). D, the Sp1, IRF, and NFAT binding sites predicted in C were mutated individually or in combination and assayed in the luciferase reporter system. p values were determined by comparing activity of the mutant construct to parental construct (star, p value > 0.05; two stars, p value < 0.00000001.

