FIGURE 2.
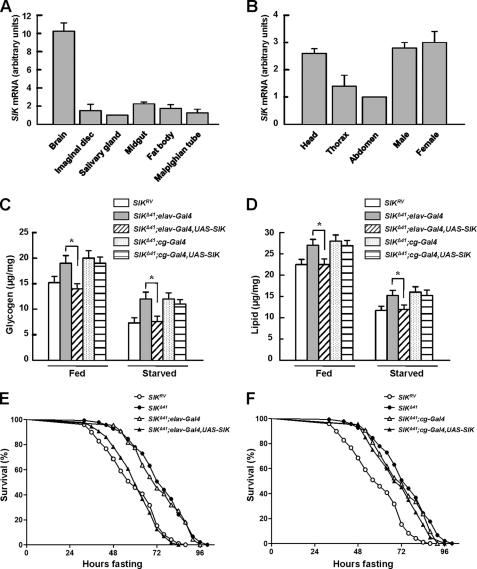
Neuronal SIK expression rescues starvation responses. A and B, the expression level of SIK was measured by quantitative real-time PCR analysis in larval (A) and adult tissues (B). Results are representative of three independent experiments and are expressed as arbitrary units (mean ± S.D.). C, total glycogen contents in fed and 24-h starved SIKRV and SIKΔ41 flies, with and without driving expression of SIK constructs using elav-Gal4 or cg-Gal4 (mean ± S.D., n = 10; *, p < 0.05, Student's t test). D, total lipid contents in fed and 24-h starved SIKRV and SIKΔ41 flies, with and without driving expression of SIK constructs using elav-Gal4 or cg-Gal4 (mean ± S.D., n = 10; *, p < 0.05, Student's t test). E, relative survival rate in response to starvation of SIKRV, SIKΔ41, SIKΔ41;elav-Gal4 control, and SIKΔ41;elav-Gal4,UAS-SIK female flies. n = 60; p < 0.05 (log rank test). F, relative survival rate in response to starvation of SIKRV, SIKΔ41, SIKΔ41;cg-Gal4 control, and SIKΔ41;cg-Gal4,UAS-SIK female flies. n = 60.

