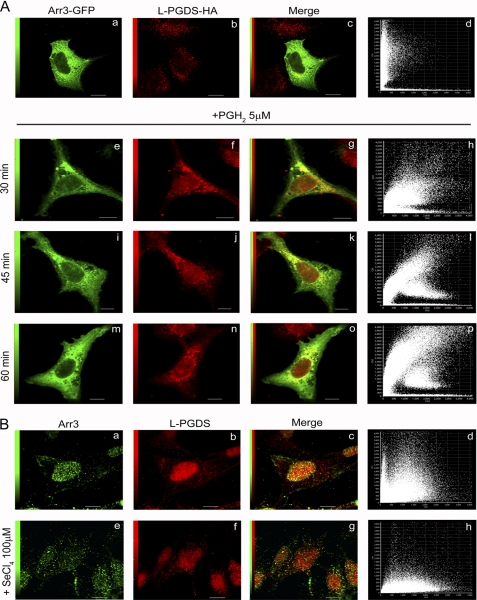
FIGURE 3.
Co-localization analysis of Arr3 and L-PGDS by confocal immunofluorescence microscopy. A, HEK293 cells were transiently transfected with Arr3-GFP and L-PGDS-HA constructs and were treated with vehicle (upper panel) or 5 μm PGH2 (lower panel) for the indicated times to stimulate L-PGDS enzymatic activity. Cells were then fixed and prepared as described under “Experimental Procedures.” Arr3-GFP is shown in green, whereas L-PGDS was visualized using anti-HA monoclonal and Alexa Fluor 546-conjugated anti-mouse IgG antibodies (red). Overlays of staining patterns (c, g, k, and o) and the corresponding pixel fluorograms (d, l, h, p) are also shown (x axis, intensity of L-PGDS pixels; y axis, intensity of Arr3-GFP pixels). A high degree of co-localization is revealed by a diagonal distribution (at 45°) of the dots on the fluorogram, whereas a lack of co-localization is characterized by two distinct populations with a minimal overlap of dots distributed toward the x and y axes, respectively. Scale bars, 10 μm. B, MG-63 cells were treated with vehicle (upper panel) or 100 μm SeCl4 (lower panel) to inhibit PGDS enzymatic activity for 15 min. Cells were then fixed and prepared as described under “Experimental Procedures.” Arr3 was visualized using anti-Arr3 monoclonal antibody and Alexa Fluor 488-conjugated anti-mouse IgG antibodies (green, a and e), whereas L-PGDS was revealed with anti-L-PGDS polyclonal and Alexa Fluor 546-conjugated anti-rabbit IgG antibodies (red, b and f). Overlays of staining patterns (c and g) and the corresponding pixel fluorograms (d and h) are shown (x axis, intensity of L-PGDS pixels; y axis, intensity of Arr3 pixels). Scale bars, 10 μm.

