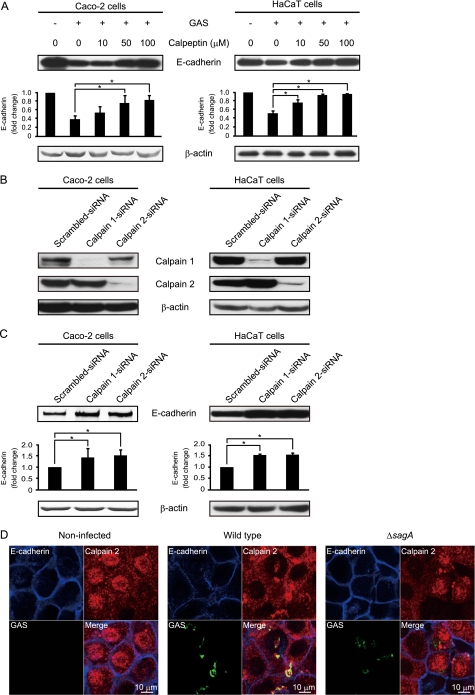
FIGURE 6.
Calpain is involved in GAS-induced disruption of intercellular junctions. A, Caco-2 and HaCaT cells were pretreated with various concentrations of calpeptin for 1 h and then infected with strain NIH35 at an MOI of 10 for 6 or 8 h. Whole cell lysates were subjected to Western blot analysis using anti-E-cadherin and anti-β-actin antibodies. β-Actin served as a loading control. The graphs below the representative blot show -fold change of E-cadherin normalized to β-actin. The intensity of the bands was quantified using Scion Image. Data are represented as the mean ± S.D. (error bars) of three independent experiments. *, p < 0.05. B, Caco-2 and HaCaT cells were transfected with calpain 1-targeted or calpain 2-targeted siRNA. A scrambled siRNA was utilized as a negative control. At 48 h after transfection, whole cell lysates were subjected to Western blot analysis using anti-calpain 1 and anti-calpain 2 antibodies. β-Actin served as a loading control. C, Caco-2 and HaCaT cells were transfected with calpain 1-targeted or calpain 2-targeted siRNA. A scrambled siRNA was utilized as a negative control. At 48 h after transfection, cells were infected with strain NIH35 at an MOI of 10 for 5 or 7 h. Cleavage of E-cadherin was detected in cell lysates by Western blot analysis using anti-E-cadherin and anti-β-actin antibodies. β-Actin served as a loading control. The graphs below the representative blot show -fold increase of E-cadherin normalized to β-actin. The intensity of the bands was quantified using Scion Image. Data are represented as the mean ± S.D. of three independent experiments. *, p < 0.05. D, HaCaT cells were infected with EGFP-expressing GAS strains at an MOI of 10 for 2 h. Extracellular E-cadherin was labeled with anti-E-cadherin and Alexa Fluor 647-conjugated antibodies as blue images, whereas calpain 2 was labeled with Alexa Fluor 594-conjugated antibodies as red images. GAS-infected cells were analyzed using a confocal laser-scanning microscope. Data shown are representative of at least three separate experiments.

