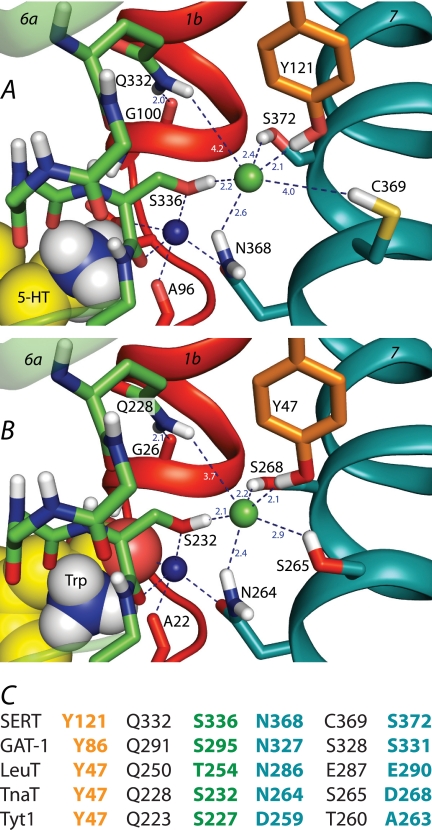
FIGURE 1.
A and B, the chloride-binding site in homology models of SERT (A) and of the D268S mutant of TnaT (B). TM helices 1 (red), 6 (green), and 7 (teal) are shown as ribbons, whereas side chains of selected residues are shown as sticks. The Cl− (green) and Na1 sodium (dark blue) ions are shown as spheres, as is the serotonin (A) or tryptophan (B) ligand. Relevant interactions or distances are indicated using dashed lines. C, comparison of candidate Cl−-binding site residues in mammalian transporters SERT and GAT-1 with the corresponding residues in bacterial NSS transporters LeuT, TnaT, and Tyt1. Cl−-binding site residues are shown in bold and color-coded by transmembrane helix (orange, TM2; green, TM6; teal, TM7).

