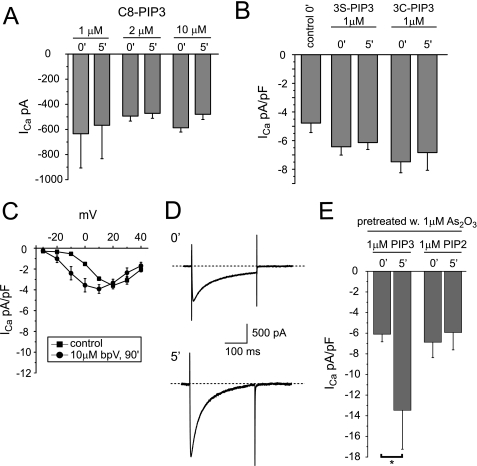
FIGURE 7.
Changes in calcium current density on internal perfusion with PIP3. A, maximal calcium current amplitudes measured in guinea pig ventricular myocytes on internal perfusion with 1, 2, or 10 μm C8-PIP3 immediately (0′) and 5 min (5′) after gaining whole cell access (n = 3–4). B, maximal calcium current densities measured in cardiomyocytes on internal perfusion with a 1 μm concentration of the metabolically stabilized PIP3 derivative C8-PIP3 (3S-PIP3) or C8-PIP3 3-methylenephosphonate (3C-PIP3) immediately and 5 min after gaining whole cell access (n = 5–6). C, averaged I-V relationships measured under control conditions or following a 90-min incubation with a 10 μm concentration of the phosphatase inhibitor bpV. D, calcium current traces elicited in a cardiomyocyte with a depolarizing test pulse to +20 mV from a holding potential of −40 mV immediately and 5 min after the start of internal perfusion with 1 μm C8-PIP3. Calcium currents were recorded following overnight incubation with 1 μm As2O3. E, maximal current densities measured in cardiomyocytes on internal perfusion with 1 μm either PIP3 or PIP2 following overnight incubation with 1 μm As2O3 immediately and 5 min after gaining whole cell access (n = 5). Note that internal application of C8-PIP3 increases calcium current density significantly at the p < 0.05 level. Error bars, S.E.

