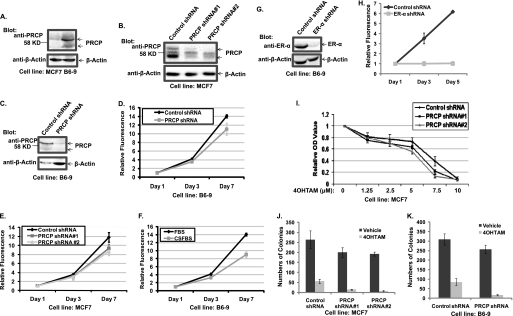
FIGURE 4.
PRCP regulates cell proliferations, which are dependent on ER-α. Overexpression of PRCP decreases and knockdown of PRCP increases 4OHTAM-induced cytotoxicity. A, whole cell lysates of MCF7 and B6-9 were probed with the goat anti-PRCP antibody. Note that two bands around the 58-kDa marker are detected by the goat anti-PRCP antibody. B, whole cell lysates of MCF7-control shRNA, MCF7-PRCP shRNA1 and -2, were probed with the mouse anti-PRCP antibody (Abcam). Note that the mouse anti-PRCP antibody detects three bands, and only the signal of the upper and lower bands is decreased in PRCP shRNA-expressing cells. C, whole cell lysates of B6-9-control shRNA and B6-9-PRCP shRNA were probed with the goat anti-PRCP antibody. D and E, cells were grown in 96-well plates (2.5 × 10³ cells/well) in octuplicate for the time indicated, stained with PicoGreen, and the average fluorescence intensity evaluated. Values at days 3 and 7 were normalized to the basal (day 1) value and presented as graphs with standard deviation shown (representative graph of two independent experiments). F, B6-9-control shRNA cells were grown in medium containing regular FBS or charcoal-striped FBS (CSFBS) were also compared for their proliferation by PicoGreen staining (representative graph of two independent experiments). G, whole cell lysates of B6-9-control shRNA and B6-9-ER-α shRNA were probed with anti-ER-α antibodies. H, B6-9-control shRNA cells and B6-9 ERα shRNA cells were grown in medium containing regular FBS, and their proliferation was compared by PicoGreen staining (representative graph of two independent experiments). I, MCF7-control shRNA and MCF7-PRCP shRNA1 and -2 cells in 96-well plates were treated with different doses of 4OHTAM for 3 days. The cells were analyzed with the MTT assay, and the average OD values from octuplicate were normalized to the vehicle-treated cells and presented as a graph with standard deviation indicated (representative graph of three independent experiments). There are significant differences between control shRNA and PRCP shRNA1 cells treated with 5 μm (p = 0.006) and 7.5 μm 4OHTAM (p = 6 × 10⁻⁵) and PRCP2 cells treated with 5 μm (p = 0.002) and 7.5 μm 4OHTAM (p = 2 × 10⁻⁵). There are no significant differences between control shRNA and PRCP shRNA1 (p = 0.08, 0.06, and 0.12) and PRCP2 (p = 0.06, 0.11, and 0.23) treated with 1.25, 2. 5, and 10 μm of 4OHTAM. J, clonogenic assay was performed in control shRNA and PRCP shRNA1 and -2 expressing MCF7 cells treated with vehicle or 5 μm 4OHTAM in triplicate. The average colony numbers were presented as a graph with standard deviation indicated (representative graph of two independent experiments). There are no significant differences between vehicle-treated control shRNA cells and PRCP shRNA1 (p = 0.21) and PRCP2 cells (p = 0.09). There are significant differences between TAM-treated control shRNA cells and PRCP shRNA1 cells (p = 0.03) and PRCP shRNA2 (p = 0.03) cells. K, clonogenic assay was performed in B6-9 control shRNA and B6-9-PRCP shRNA cells treated with vehicle or 5 μm 4OHTAM in triplicate. The average colony numbers were presented as a graph with standard deviation indicated (representative graph of two independent experiments). There is no significant difference between vehicle-treated B6-9-control shRNA cells and B6-9-PRCP shRNA cells (p = 0.2). There is significant difference between 4OHTAM-treated B6-9-control shRNA cells and B6-9-PRCP shRNA cells (p = 0.02).

