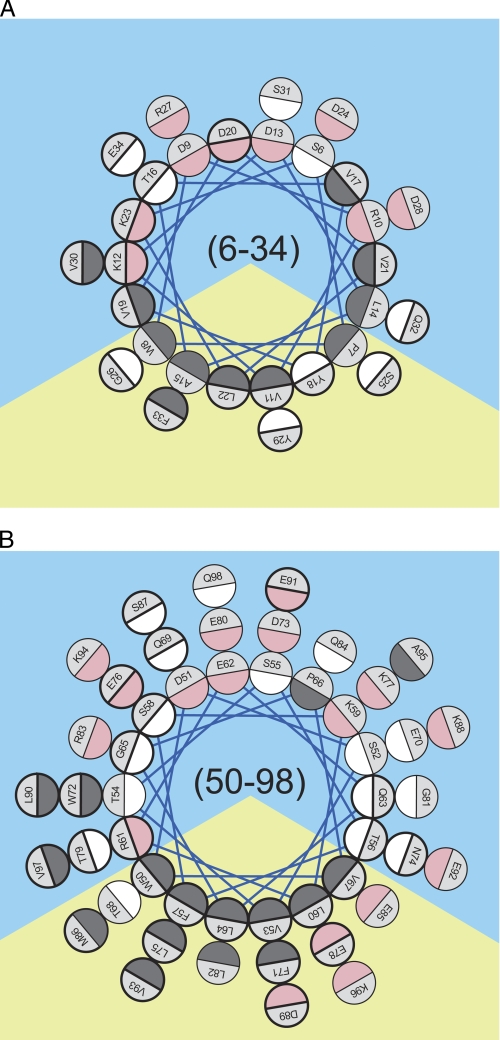
FIGURE 3.
Edmundson helical wheel analysis of residues 6–34 (A) and 50–98 (B). Helical projections were generated assuming a perfect α-helical periodicity of 3.6 residues per helical turn (58). The color code is dark gray for hydrophobic, white for polar and uncharged, and pink for charged residues. Prediction of the orientation of the amphipathic wheels was solely based on clustering of the hydrophobic residue on a sector of the wheel. The apolar and polar solvation space is represented by yellow and blue backgrounds, respectively. Residues that display a spectral characteristic corresponding to low motional freedom (δ−1≤ 0.27) (supplemental Table S1) are circled with bold lines.

