FIGURE 2.
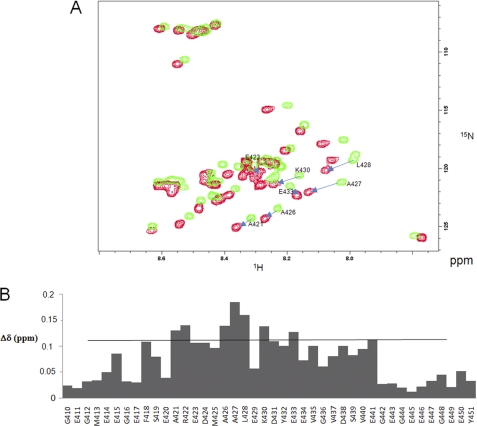
Titration analyses of the interaction between Tau and αTub410C. A, 1H-15N HSQC of 80 μm αTub410C in 20 mm MES-KOH, pH 6.9, 1 mm DTT, at T = 20 °C in the absence (green) and presence (red) of 10 μm Tau. Residues with the greatest chemical shift perturbations are shown. B, mapping of the chemical shift perturbations observed in the 1H-15N HSQC Tau-αTub410C titration experiments. The chemical shift perturbation values were calculated as described under “Materials and Methods.”

