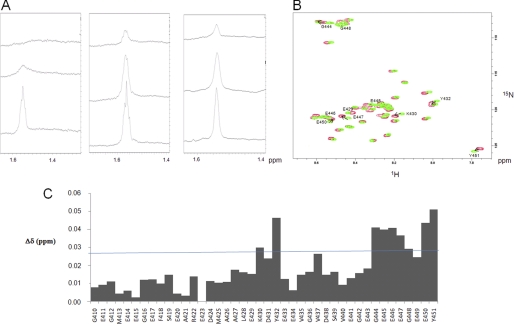
FIGURE 4.
Small polyamines interact with tubulin through electrostatic bonds. A, left, one-dimensional 1H NMR spectrum (zoomed) in the 1.4–1.6 ppm region obtained with 40 μm tubulin, 20 mm MES-KOH, pH 6.9, 2 mm MgCl2, 20% glycerol at T = 20 °C in the presence of 300 μm (upper spectrum) or 1 mm (middle spectrum) spermine. 500 mm KCl was added at the end of the experiment in the sample to examine the impact of high ionic strength (lower spectrum). Middle, one-dimensional 1H NMR spectrum (zoomed) on the 1.4–1.6 ppm region obtained with 40 μm tubulin, 20 mm MES-KOH, pH 6.9, 2 mm MgCl2, 20% glycerol at T = 20 °C in the presence of 300 μm (upper spectrum) or 1 mm (middle spectrum) putrescine. 500 mm KCl was added at the end of the experiment in the sample to examine the impact of high ionic strength (lower spectrum). Right, one-dimensional 1H NMR spectrum (zoomed) in the 1.4–1.6 ppm region obtained with 40 μm tubulin S, 20 mm MES-KOH, pH 6.9, 2 mm MgCl2, 20% glycerol at T = 20 °C in the presence of 300 μm (upper spectrum) or 1 mm (middle spectrum) spermine. 500 mm KCl was added at the end of the experiment in the sample to examine the impact of high ionic strength (lower spectrum). B, 1H-15N HSQC spectrum of 200 μm αTub410C in 20 mm MES-KOH, pH 6.9, at T = 20 °C in the absence (green) and presence (red) of 3 mm spermine. The amino acid residues with the most perturbated chemical shifts are indicated. C, chemical shift perturbations from the 1H-15N HSQC spectrum observed in the absence and presence of 3 mm spermine. The chemical shift perturbation values were calculated according to the formula, ((Δδ1H)2 + (Δδ15N)2/6.52)½ (31).

