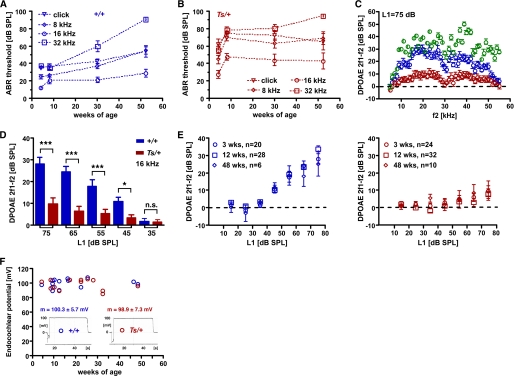
FIGURE 2.
Audiological characteristics of Ts. A and B, shown are ABR thresholds in db SPL of +/+ (A) and Ts/+ (B) mice at 4, 8, 30, and 52 weeks of age. Thresholds for click (triangle), 8 (diamond), 16 (circle), and 32 kHz (square) are given as the mean ± S.D. (see also Table 1). C, shown are DPOAE amplitudes at the 2f1 − f2 frequency and L1 = 75 db relative to the noise floor of +/+ (blue circle), Ts/+ (red circles), and C3HeB/FeJ (green circle) mice at 3 weeks of age. Mean values ± S.E. of 20 +/+, 24 Ts/+, and 12 C3HeB/FeJ ears are plotted. x axis shows f2 sweep frequency. D, shown are DPOAE amplitudes at the f2 = 16 kHz frequency for input levels (L1) ranging from 35 to 75 db SPL. Mean values ± S.E. of 20 +/+ (blue bars) and 24 Ts/+ (red bars) are shown. ***, p < 0.001; *, p < 0.05, n.s. = not significant. E, shown are DPOAE amplitudes at the f2 = 16 kHz frequency for input levels (L1; x axis) of +/+ (left panel) and Ts/+ (right panel) at 3 (circle), 12 (square), and 48 weeks of age (diamond). Output level in db SPL relative to noise floor of the 2f1 − f2 frequency (y axis) is plotted against input L1 levels (x axis). The data are given as mean ± S.E.; n = number of ears tested. F, given are endocochlear potentials of +/+ (blue label) and Ts/+ (red label) mice at the indicated age (x axis). Each circle refers to one measurement, and the mean ± S.D. across all ages is given for +/+ and Ts/+ mice. Output level in db SPL relative to noise floor of the 2f1-f2 frequency (y axis) is plotted against input L1 levels (x axis). Values are given in millivolts (mV). A representative read-out for each genotype is given as inset.

