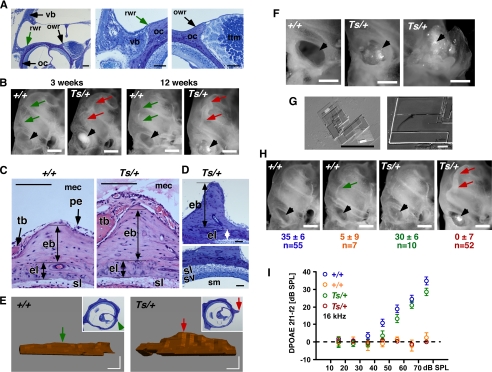
FIGURE 3.
Ectopic ossification and cholesterol crystal deposition in the middle ear. A, images of plastic-embedded toluidine-stained cross-sections through the mouse temporal bone at 4 weeks of age. Bone of the ventral bulla (vb, black arrow) is indicated. Location of the round window ridge (arrow) and oval window ridge (black arrow) is indicated; oc, otic capsule; ttm, tympanic tensor muscle; scale bar, 100 μm. owr, oval window ridge; rwr, round window ridge. B, photographs of the cochlea of +/+ and Ts/+ mice at 3 and 12 weeks of age are shown. Location of round window ridge in +/+ (green arrows) and in Ts/+ (red arrows) is shown. Black arrowhead points to the round window. Note crystal deposition in the round window of Ts/+ ears but not in +/+ ears; scale bar, 500 μm. C, images of paraffin-embedded hematoxylin and eosin-stained cross-sections through the round window ridge in +/+ and Ts/+ ears at 12 weeks of age. vb, ventral bulla; pe, periosteum; eb, endochondral bone; el, endosteal layer; sl, spiral ligament; mec, middle ear cavity; tb, tympanic part of temporal bone; scale bar, 100 μm. D, images of plastic-embedded toluidine-stained cross-sections through the round window ridge of a Ts/+ ear at 11 weeks of age (nøbben). sv, stria vascularis; sl, spiral ligament; sm, scala media; eb, endochondral bone; el, endosteal layer; scale bar, 50 μm. E, three-dimensional reconstruction of the round window ridge in +/+ (left) and Ts/+ (right) mice at 11 weeks of age. Inset shows a representative cross-section used for the reconstruction. Arrow points to the corresponding location of the round window ridge in the section and three-dimensional model; scale bar, 50 μm. F, photographs of the round (left and middle panel) and oval (right panel) window in +/+ (left panel) and Ts/+ (middle and right panel). Note the excessive crystal deposition at the round (middle) and around the ossicles at the oval (right) window (arrow head); scale bar, 500 μm. G, bright field (left) and scanning electron microscope (right) image of crystal deposits isolated from the round window of Ts/+ ears; scale bar, 100 and 50 μm. H, photographs of cochlea of +/+ and Ts/+ mice showing crystal deposition at the round window (black arrowhead) and nøbben formation (red arrow) as function of DPOAE levels. Emission levels are given in db SPL at f2 = 16 kHz input frequency and L1 = 75 db SPL input level. Mean ± S.D. are given for number (n) of ears tested. Note the normal round window ridge and no crystal deposition in Ts/+ ears with normal DPOAEs; scale bar, 500 μm. I, input/output function of DPOAEs at f2 = 16 kHz of +/+ (n = 62) and Ts/+ (n = 62) ears showing two discrete classes of phenotypes in each genotype. Average age of +/+ mice was 16 weeks (range: 3–48) and Ts/+ mice was 17 weeks (range, 3–48). Output levels in db SPL relative to noise floor on y axis, and L1 input levels at the x axis. Symbols represent mean ± S.E.

