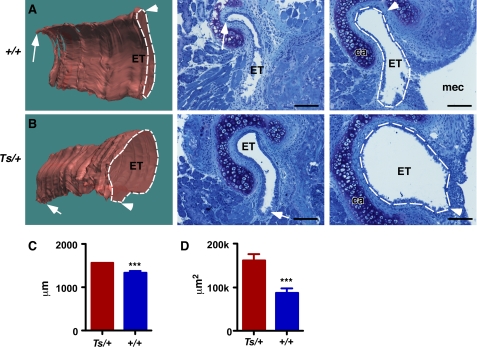
FIGURE 5.
Enlarged Eustachian tube in Ts. A and B, three-dimensional reconstructions of the Eustachian tube of a 3-week-old +/+ (A) and Ts/+ (B) ear based on serial sections. Representative sections are shown in the middle and right panel. The lumen of the Eustachian tube is outlined by the white lines. Orientation and location of sections on the respective three-dimensional model are shown as arrow and arrowhead. MEC, middle ear cavity; ET, Eustachian tube; ca, cartilaginous tissue; m, medial; d, dorsal. Scale bar, 50 μm. Volume of ET in Ts/+ measured 50,489,630 μm3 and in +/+, it was 17,418,522 μm3. C and D, graphs showing perimeter (B) and cross-sectional area (D) of ET in Ts/+ and +/+; n = 5 serial sections. ***, p < 0.001.

