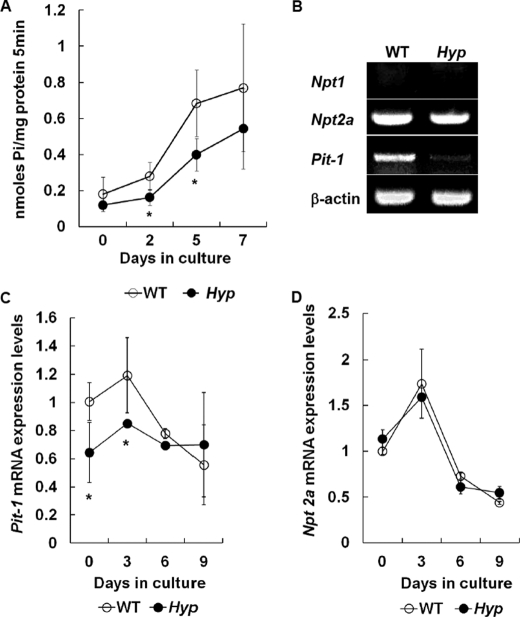
FIGURE 3.
Characterization of Hyp chondrocytes. A, time course of Pi uptake in WT (○) and Hyp (●) chondrocytes. The cells were cultured for 7 days in the differentiation medium, and Pi uptake was determined as described under “Experimental Procedures.” B, expression of Npt1, Npt2a, and Pit-1 mRNAs in WT and Hyp chondrocytes. Total RNA isolated from chondrocytes cultured for 24 h was used for RT-PCR analysis using the primer pairs. β-Actin was amplified as a control. C, time-dependent expression of Pit-1 mRNA by real-time PCR. D, time-dependent expression of Npt2a mRNA by real-time PCR. The amount of Npt2a and Pit-1 of WT chondrocytes at day 0 was designated as 1.0 and normalized to GAPDH. Results are expressed as the mean ± S.E. of four separate experiments. *, significantly different from WT chondrocytes (p < 0.05).

