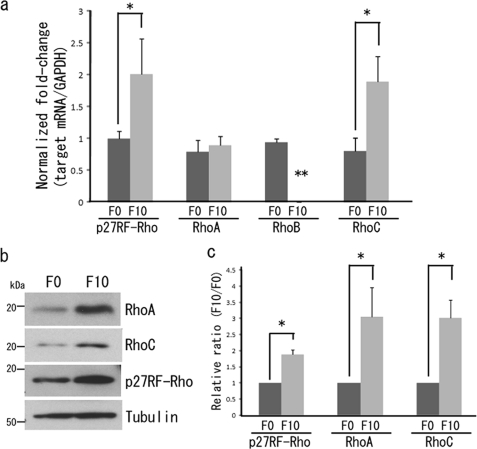
FIGURE 1.
Analysis of Rho mRNA and protein in B16 melanoma cells. a, quantitative PCR analysis of p27RF-Rho, RhoA, RhoB, and RhoC in B16F0 and B16F10 cells. Gene expression was normalized to that of GAPDH and presented as the ratio of expression in B16F0 relative to B16F10 cells. The data are presented as the means ± standard deviation (n = 3). *, p < 0.05. **, not detected. b, protein levels of p27RF-Rho, RhoA, and RhoC in B16F0 and B16F10 cells. c, quantification of Fig. 1B. The data are presented as the means ± standard deviation (n = 3). *, p < 0.05.

