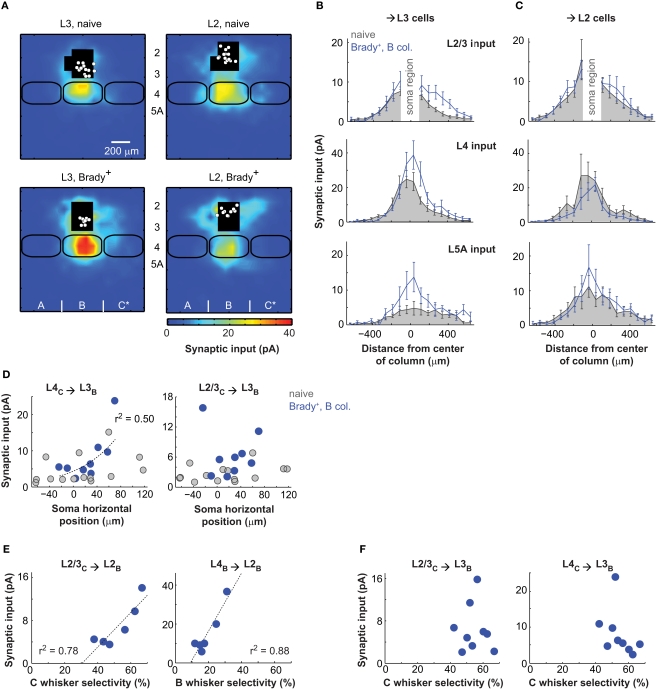
Figure 3.
Distinct plasticity in layer 2 and layer 3. (A) Synaptic input maps of L3 (left) and L2 (right) cells recorded in naive (top) and Brady+ (bottom) mice. (B) Horizontal profiles of synaptic inputs for L3 cells. The analyzed regions of inputs are as in Figure 2G. (C) Same as in B for L2 cells. (D) Strength of transcolumnar L4C → L3B and L2/3C → L3B projections as a function of soma horizontal position. Zero on the x-axis is the center of the B column. (E) Strength of transcolumnar L2/3C → L2B projections as a function of selectivity of the C-evoked cardiac responses (left) and strength of ascending L4B → L2B projections as a function of selectivity of the B-evoked cardiac responses (right). Each point corresponds to one mouse and averages the inputs of one to three cells. (F) Same as in E for L2/3C → L3B and L4C → L3B projections and the selectivity of C-evoked cardiac responses.

