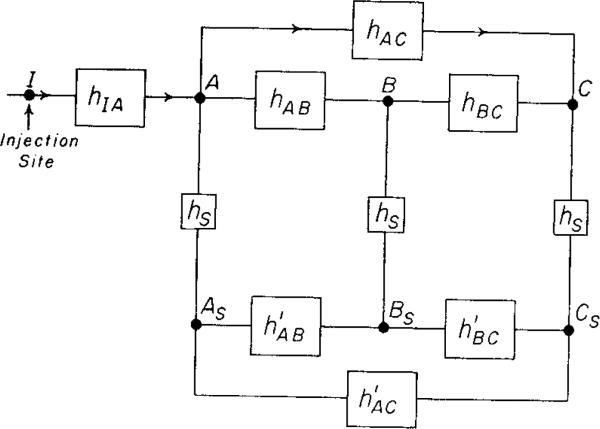
FIG. 1.
Block diagram of the experiment. The bolus of injectate introduced at I (pulmonary artery or left ventricle) is somewhat dispersed in the vascular system by the process hIA(t) before it reaches the three aortic sampling sites A, B, and C. The sampling system transport functions, hs(t), were identical, so that the transport functions , , or between pairs of the simultaneously recorded curves As, B , and Cs, would be the same as the transport functions hAB, hBC, or hAC between the corresponding pairs of the actual arterial curves.

