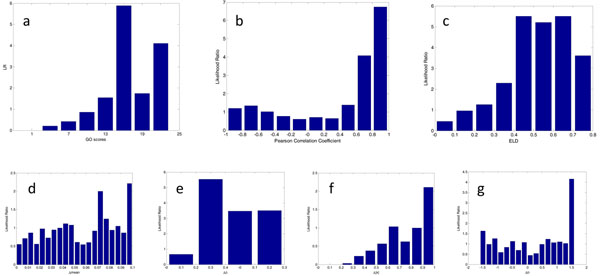
Figure 8.
Parameters contributing to the probability prediction (yeast cell cycle). a) Positive likelihood ratio in different bars of GO scores; b) Likelihood ratio distribution of regulation pairs based on PCC; c) Likelihood ratio distribution of regulation pairs based on ELD; d) Likelihood distribution of the differences in mean value of expression levels; e) Likelihood distribution of the differences in standard deviation of expression levels; f) Likelihood distribution of the differences in modulus of expression levels; and g) Likelihood distribution of the differences in angle of expression levels.

