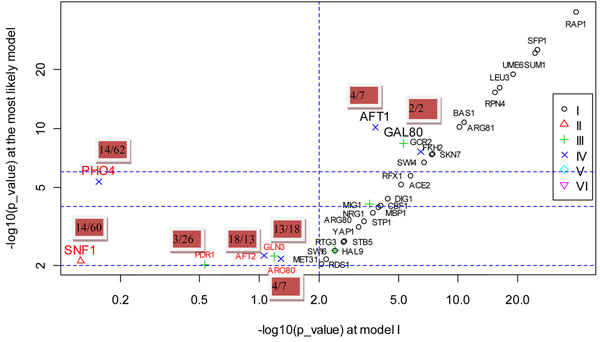
Figure 3.
The overlap significance obtained from the most likely model vs. that obtained from simple direct model on Hu et al.’s data. note: different symbols denote the type of models for which the most overlap significance occurs. I: simple direct model; II: PTM-mediated direct model; III: two-layer cascade regulation model; IV:PTM-mediated two-layer cascade regulation model; V:hybrid two-layer cascade regulation model; VI:three-layer cascade regulation model. TFs with red fonts denote those correctly identified by our method but missed if only Model I was used. TFs with large size of fonts denote those whose overlaps between the expected and observed DEGs in the most likely model are 100 times more significant than that in Model I. The number in the red rectangle denotes the rank of the perturbed TF in the list of candidates (the rank obtained by our method/ the rank obtained if only Model I was used.).

