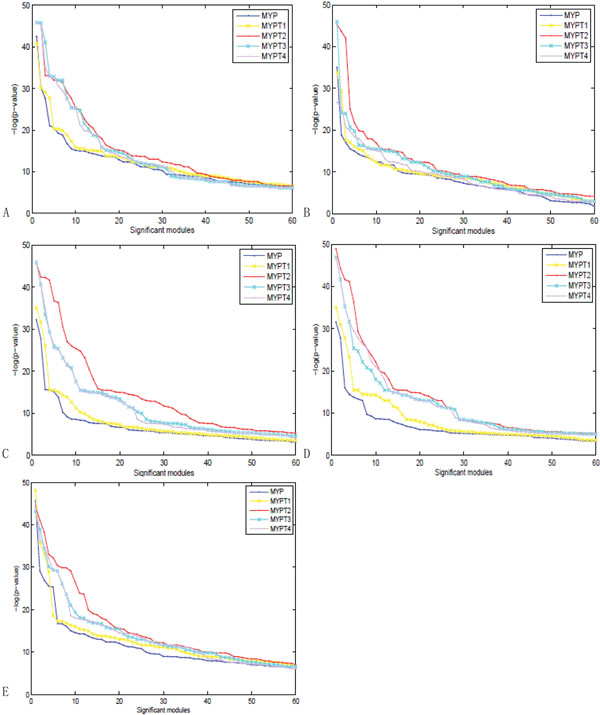
Figure 8.
Comparison of the complex annotation p-value for the functional modules identified by different methods. The complex annotation p-value of the identified functional modules via different methods on MIPs Yeast PPIs with adding different number of functional protein pairs, (a) Hierarchical algorithm based on Clustering coefficient similarity matrix (HCcc) and (b) Hierarchical algorithm based on Neighborhood similarity (HCnb), (c) MCL, (d) MCODE and (e) NG.

