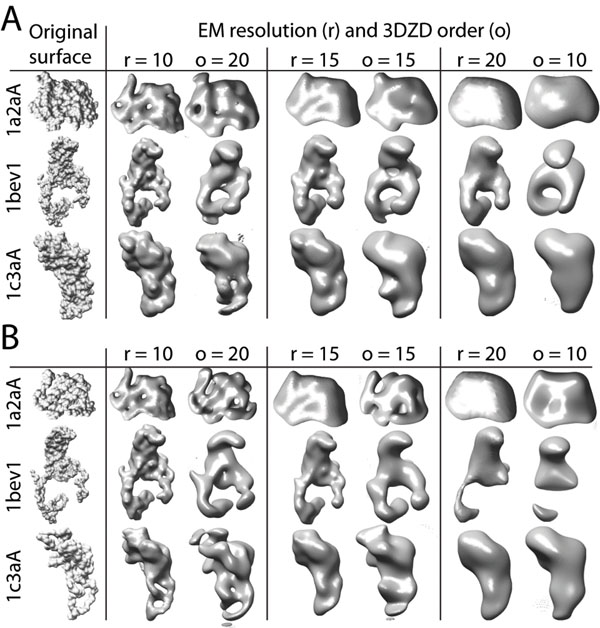
Figure 6.
Comparisons of isosurfaces of EM maps and reconstructed molecular surface from the 3DZD. Three different EM resolutions (r=10, 15, and 20) and comparable surface shape reconstructed from the 3DZDs (order o = 20, 15, and 10) are shown. A, the 3DZDs are computed for AASurf representation of proteins, from which the surfaces are reconstructed. B, the CACNO representation is used to compute the 3DZDs.

