Abstract
Restless legs syndrome (RLS) is a neurological disorder that is thought to involve decreased iron availability in the brain. Iron is required for oxidative metabolism and plays a critical role in redox reactions in mitochondria. The recent discovery of mitochondrial ferritin (FtMt) provided the opportunity to identify a potential correlation between iron and mitochondrial function in RLS. Human substantia nigra (SN) and putamen autopsy samples from 8 RLS cases and 8 controls were analyzed. FtMt levels in RLS SN tissue homogenate samples assessed by immunoblots had more FtMt than control samples (p < 0.01), whereas there were no significant differences in FtMt in the putamen samples. By immunohistochemistry, neuromelanin-containing neurons in the SN were the predominant cell type expressing FtMt. Staining in neurons in RLS samples was consistently greater than that in controls. Cytochrome c oxidase staining, which reflects numbers of mitochondria, showed a similar staining pattern to that of FtMt whereas there was less immunostaining in the RLS cases for cytosolic H-ferritin. These results suggest that increased numbers of mitochondria in neurons in RLS and increased FtMt might contribute to insufficient cytosolic iron levels in RLS SN neurons; they are consistent with the hypothesis that energy insufficiency in these neurons may be involved in the pathogenesis of RLS.
Keywords: Ferritin, Iron, Mitochondrion, Neuron, Restless leg syndrome
INTRODUCTION
Restless legs syndrome (RLS) is a sensorimotor disorder that may affect 5% to 10% of the population (1) and is more common in women than in men (2). Individuals with RLS report an urge to move the legs usually accompanied by abnormal sensations in their legs, particularly during rest; these symptoms are relieved by voluntary or involuntary movement. There is a circadian rhythm to the symptoms, with sensory symptoms and resulting movements increased in the evening and peak at night (3).
RLS has been closely associated with decreased concentration of iron in the brain and alterations in expression of iron management proteins. Both magnetic resonance imaging and transcranial sonography indicate that there is decreased iron in substantia nigra (SN) of RLS patients (4-6). Moreover, cerebrospinal fluid from RLS patients reflects an iron-deficient profile as demonstrated by decreased ferritin and increased transferrin (7). Indeed, decreased CSF ferritin has been a consistent finding in early onset RLS (7-10). In contrast, plasma iron, ferritin, and transferrin levels that reflect systemic iron status are in general within normal ranges in RLS patients (7, 9).
Within the brain, histological examination of the SN in autopsy tissue samples has suggested decreased iron in melanin-containing neurons in RLS compared to controls (8); immunostaining and quantitative analyses have revealed an increase in transferrin and decrease in ferritin and transferrin receptor (8, 10). This pattern of expression of transferrin and ferritin indicates cellular iron deficiency (11). Iron has many roles at the cellular level but it is an essential component of many mitochondrial enzymes. It is a required co-factor for enzymes of the respiratory chain in complexes I-IV and can also regulate translation of the 75-kDa subunit of complex I (12) and complex II (13). Iron is trafficked to the mitochondria by proteins of the ATP-binding cassette family (14). Recently it has also been suggested that iron loading into the mitochondria can occur through mitoferrin but this phenomenon has not yet been demonstrated in the brain (15). How iron is subsequently managed within mitochondria (i.e. storage and availability to proteins) is not understood. Inadequately managed iron can lead to oxidative stress through the generation of reactive oxygen species, which are produced by mitochondria themselves due to oxidative phosphorylation within the electron transport chain. Reactive oxygen species disrupt mitochondrial function; indeed, a considerable body of the literature has evolved around mitochondrial dysfunction in neurological disorders (16).
The availability of iron in cells is managed by sequestering it in ferritin in the cytosol. Sequestration of iron in ferritin has been shown almost universally among cell types to protect from iron-mediated oxidative stress. The mechanisms of sequestration of iron within the mitochondria are poorly understood. Recently, a mitochondrial ferritin (FtMt) has been identified. This protein has high sequence homology to H-ferritin, including conservation of the ferroxidase center and activity (17, 18); however, it has a positively charged leader sequence that provides it with a means to access to the mitochondria (17). Mitochondrial ferritin has been detected at very low levels in most organs including the brain (17), but levels are high in the testes in which mitochondria are abundant (18, 19). The function of FtMt has not been elucidated and the iron content of mitochondrial ferritin has not been directly assessed in vertebrates but in a yeast model it plays a role in iron sequestration since up to 50% of mitochondrial iron has been associated with this protein (20). Over-expression of FtMt can draw iron from the cytosolic iron pool to the mitochondria and create cellular iron deficiency (21, 22). Moreover, FtMt prevents oxidative stress in a cellular model in which the mitochondrial iron chaperone frataxin is deficient (20). Despite its apparent role in cellular iron homeostasis, the regulation of FtMt differs from the cytosolic ferritins because FtMt does not contain an iron-responsive element in the mRNA (17). Thus, unlike cytosolic ferritin it is not directly responsive to the cellular labile iron pool. The goal of the present study was to determine if there are differences in mitochondrial ferritin expression in RLS versus controls.
MATERIALS AND METHODS
Immunohistochemistry
Formalin-fixed tissue blocks from the SN of 6 RLS patients (age range 67 to 86 years) and 6 controls (age range 66 to 87 years) were obtained from the Harvard Brain Tissue Resource Center, Belmont, MA. All SN samples were from females. Formalin-fixed tissue blocks from the putamen were obtained from the same source; the latter blocks included 12 control samples (9 male; 3 female) and 8 RLS samples (all female). The age ranges of the putamen samples were 49 to 87 years for the controls and 53 to 86 years for the RLS cases. The tissue blocks were embedded in paraffin and sectioned at 10 μm.
Immunohistochemistry was used to detect FtMt, H-ferritin and cytochrome c oxidase (COX). Briefly, the sections were deparaffinized and then hydrated. Neuromelanin was bleached from the SN sections by incubating the slides for 2 hours in 10% H2O2, pH 7.4, according to published methods (23), and then washed with distilled water. The sections then underwent antigen retrieval with 10 mM citrate buffer, pH 6.0. Endogenous peroxidase activity was quenched by exposure to methanol/ H2O2 followed by blocking for 1 hour in 2% non-fat milk made in phosphate buffered saline. Tissue was incubated overnight with either mouse anti-human mitochondrial ferritin antibody (from S. Levi) (22), mouse anti-human monoclonal antibody for H-ferritin (from P. Arosio and S. Levi) (24), or a polyclonal rabbit anti-COX antibody (ab66739, Abcam, Cambridge, MA) diluted 1:200 in PBS containing 1% non-fat milk and 0.1% of Triton-X. Control staining was performed on sections lacking the primary antibody.
Sections were washed in PBS and then incubated for 1 hour with biotinylated anti-mouse secondary antibody (Vectastain Elite ABC kit, PK-6102, Vector Labs, Burlingame, CA) for FtMt and H-ferritin or biotinylated anti-rabbit secondary antibody (Vectastain Elite ABC kit, PK-6101, Vector Labs) for COX diluted 1:200 in PBS containing 1% non-fat milk and 0.1% of Triton-X. Control staining was performed on sections lacking the secondary antibody. After washing in PBS, sections were incubated with the AB Complex (ABC) for 1 hour. Sections were then exposed to activated 3,3’-diaminobenzidine (SK-4100, Vector Labs) with nickel chloride enhancement, washed, dehydrated, and coverslipped.
Quantitative Analysis
Fresh frozen samples of human SN and putamen were obtained from the Harvard Brain Tissue Resource Center. Approximately half of the tissue samples were from the same patients as used for immunohistochemistry. SN tissue included samples from 8 RLS patients (age range 53 to 86 years, all female) and 8 age-matched controls (age range 66-81 years, 5 female, 3 male). Control putamen samples were from 9 males and 3 females; all 8 RLS putamen samples were from females and were from the same patients as the SN samples. The age ranges of the putamen samples were 49 to 87 years for the controls.
Samples were homogenized on ice in homogenization buffer containing protease inhibitor cocktail with an Ultra-Turrax T25 homogenizer. Each sample was applied in triplicate to nitrocellulose membrane using a slot-blot apparatus (Minifold II, Schleicher and Schuell, Keene, NH) at a concentration of 1 μg/ml and a total volume of 100 μL. The membrane was blocked in 5% non-fat milk made with Tris-buffered saline (TBS) for 1 hour at room temperature (RT), followed by incubation for 1 hour at RT with primary mouse anti-human mitochondrial ferritin (21) diluted 1:1000 in 5% non-fat milk made with TBS with Tween (TBS-T). The membrane was incubated with secondary antibody (anti-mouse IgG conjugated to horseradish peroxidase [NA931V, GE Healthcare UK Limited, Little Chalfont Buckinghamshire, UK]) diluted 1:5,000 in 5% non-fat milk made in TBS-T for 1 hour and then exposed to chemiluminescent substrate (Western Lightning PLUS ECL, NEL 105001EA, Perkin Elmer, Waltham, MA) for 1 minute and exposed to film.
Statistical Analysis
Optical Density (OD) values from the slot blots were obtained using a GS800 Calibrated Densitometer (Bio-Rad, Hercules, CA) and background OD was subtracted. The values from each triplicate sample for each patient were averaged to obtain a mean OD value. These mean OD values were subjected to statistical analysis using the Mann Whitney U test in GraphPad Prism software (Version 4.03, GraphPad Software, Inc., La Jolla, CA).
RESULTS
Immunoblot Quantification of Human Samples
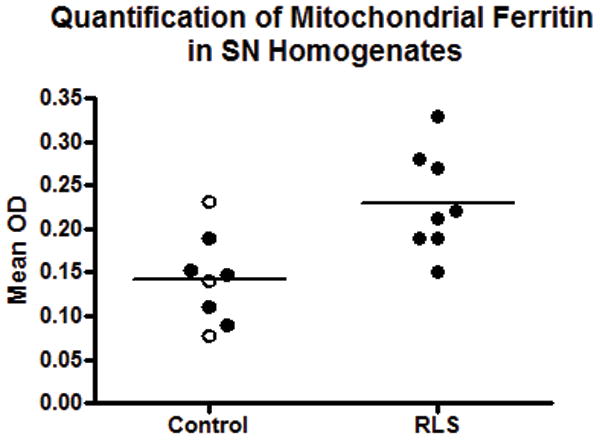
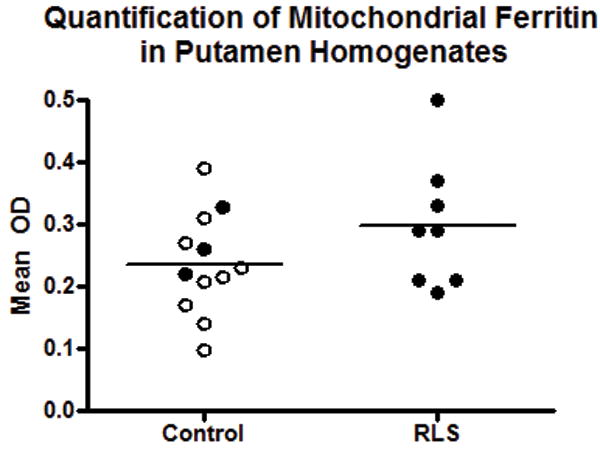
There was a 51% increase in the concentration of FtMt in the RLS SN compared to controls (p < 0.01) (Fig. 1). Since little is known about gender differences in FtMt expression, males were removed from the control group in a separate analysis. Comparison of the control females to the (all female) RLS group indicated a significant 47% increase (p < 0.01) of FtMt in RLS (not shown). Putamen homogenates were analyzed in a similar manner and there was no difference between the control and RLS groups (Fig. 2); separate analysis of only female subjects also did not yield a significant difference (not shown).
Figure 1.
Quantification of mitochondrial ferritin (FtMt) in the substantia nigra (SN). FtMt levels are significantly increased (51%) in restless leg syndrome (RLS) compared to control autopsy SN homogenates (p < 0.01).
Figure 2.
Quantification of mitochondrial ferritin (FtMt) in the putamen. FtMt levels are not different in restless leg syndrome (RLS) compared to control autopsy putamen homogenates. Open circles are males in the control group; filled circles are females. Lines indicate median values.
Mitochondrial Ferritin Immunohistochemistry
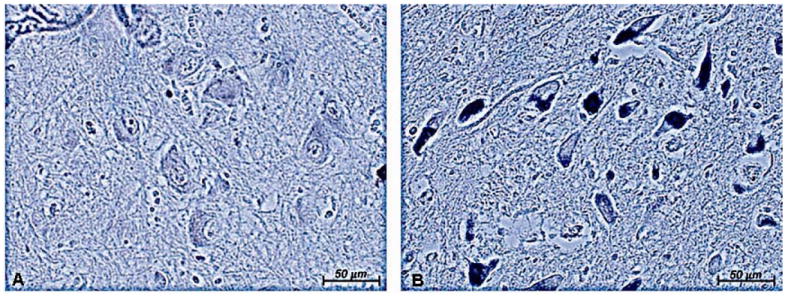
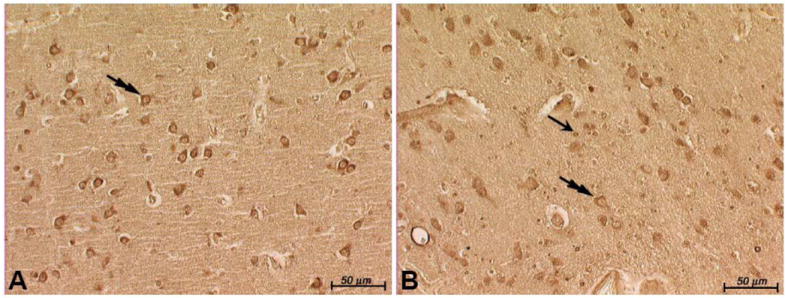
FtMt immunoreactivity was detected in both the SN and in the putamen (Figs. 3, 4). In the SN, the reaction product was primarily observed throughout the somata of neuromelanin-containing neurons in both RLS and control tissues (Fig. 3A). The staining intensity was much less in the controls than in the RLS SN (Fig. 3B). This is consistent with the quantitative data and suggests the neurons account for most of the mitochondrial ferritin expressed. In the putamen, staining was very similar in control and RLS with no discernible differences in intensity or cellular distribution (Fig. 4).
Figure 3.
Mitochondrial ferritin (FtMt) immunostaining in the substantia nigra (SN). There is less neuronal FtMt staining in control SN (A) compared to restless leg syndrome SN. Neuromelanin has been bleached from the neurons; the blue background and immunoreaction product for FtMt are due to the use of nickel chloride in the chromogen reaction (B). Original magnification = 20×.
Figure 4.
Mitochondrial ferritin (FtMt) in the putamen. The numbers of FtMt-stained neuronal cells are similar in the control (A) and restless leg syndrome (RLS) (B) putamen (double arrowheads). There is glial staining in the RLS putamen (single arrow in B).
COX Immunohistochemistry
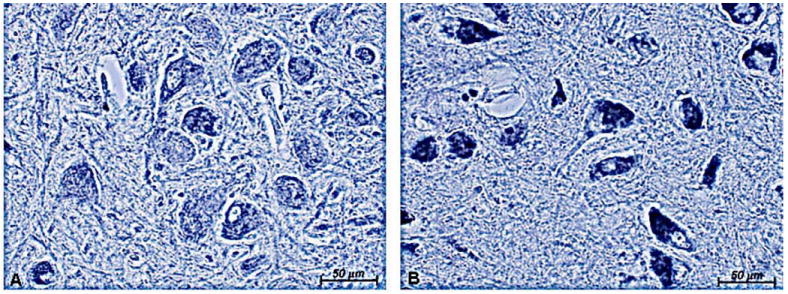
The increase in FtMt in RLS could reflect more mitochondria or more FtMt per mitochondria. To differentiate between these possibilities, staining for the mitochondrial protein COX was performed on SN sections; COX immunostaining intensity should reflect the numbers of mitochondria in the sample (25). The staining intensity for COX was dramatically greater in neuromelanin-containing cells in the RLS tissue compared to control (Fig. 5), suggesting that mitochondrial density is greater in the RLS SN than in the controls.
Figure 5.
Cytochrome c oxidase (COX) immunostaining in the substantia nigra (SN). There is less neuronal staining in control SN (A) compared to restless leg syndrome (RLS) SN (B). Original magnification = 20×. COX staining is more intense in the RLS SN.
H-ferritin Immunohistochemistry
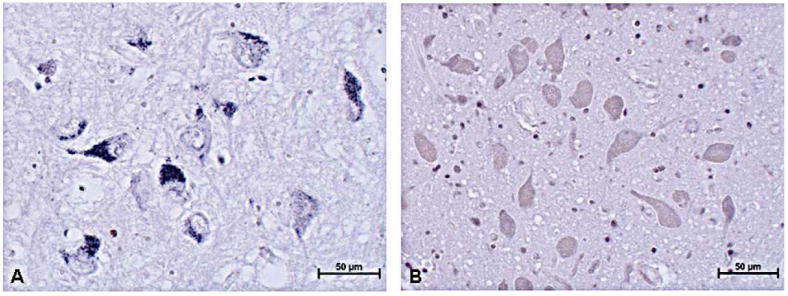
There is homology between FtMt and H-ferritin. We had previously found a decrease in H-ferritin immunostaining in neuromelanin-containing cells in RLS compared to control (8, 9). Therefore, we immunostained this new set of samples for H-ferritin. Immunostaining for H-ferritin in control tissue was relatively strong in neurons and in some glia (Fig. 6A), whereas in RLS samples, neuron immunostaining was lighter but there appeared to be more immunopositive glia (Fig. 6B).
Figure 6.
H-ferritin staining in the substantia nigra (SN) after bleaching of neuromelanin. The blue reaction product in the neurons in control tissue (A) is more intense than in the restless leg syndrome (RLS) neurons (B). Brown neuromelanin can be detected in the RLS neurons (B) because of the relative absence of the immunoreaction product for H-ferritin. The numerous small round cells that are stained in the RLS tissue appear to be glia, whereas there are relatively few immunostained glia in the control sample. Original mag. = 20×.
DISCUSSION
We demonstrated that SN FtMt levels are significantly greater in RLS than in control samples and that FtMt immunoreactivity was predominantly in neuromelanin-containing neurons in the SN. There were no differences between control and RLS in the amount or cellular distribution of FtMt in the putamen. Whether the increase in FtMt in the SN was a result of higher FtMt concentration or mitochondrial proliferation with normal amounts of FtMt could not be determined but greater immunostaining for COX suggests an increase in mitochondria (25). Thus, greater FtMt immunostaining in the SN in RLS suggests that it is associated with an increase in mitochondria.
FtMt is reportedly not regulated by cellular iron levels (17). Thus, elevated levels of FtMt in neuromelanin-containing neurons in RLS do not provide direct information on the iron status of these cells. Compelling data, however, suggest that an increase in FtMt would decrease cytosolic iron (21). Therefore, the increase in FtMt coupled with the increased iron demand of more mitochondria would be consistent with our previous report of less stored iron (based on decreased levels of H-ferritin) in neuromelanin-containing cells in RLS compared to controls (8, 10). The demonstration of a decrease in H-ferritin immunostaining in samples not previously examined (Fig. 6) further substantiates the distinction between cytosolic H-ferritin and FtMt and their independent regulation.
A decrease in cytosolic iron availability could affect the production of iron-dependent proteins and be associated with the decrease in the iron-sulfur containing iron regulatory protein 1 in neuromelanin-containing cells in RLS (10). Indeed, iron deficiency prevents iron-sulfur protein generation and maturation of iron-sulfur-containing mitochondrial proteins (26). Therefore, a decrease in cytosolic iron-sulfur proteins may be a consequence of maintaining mitochondrial functions essential for cell survival, for example, production of tyrosine hydroxylase that appears to be normal or even elevated in the RLS SN (8). The possibility of increased mitochondria in RLS neuromelanin-containing cells also suggests that there is a greater metabolic demand by these cells than in controls. Very little is known about the metabolic activity of the SN in RLS, however, and this appears to be an area that should be investigated further, such as with neuroimaging.
The reasons for increased mitochondriogenesis in RLS is not known. The incidence of RLS is higher in women than men and increased folate availability has been found to upregulate mitochondriogenesis in brain and other tissues (27). The activation of mitochondrial transcription factors increases mitochondrial proliferation (28) and these transcription factors are regulated by estrogen (29) and estrogen-related receptors (30). Neuronal mitochondrial biogenesis in adults has been reported in response to transient hypoxia (31) and there is some evidence of activation of hypoxia pathways in the neuromelanin-containing cells in RLS (32). In transient hypoxia, mitochondriogenesis resulted from activation of neuronal nitric oxide synthase (nNOS) (31, 33) and genetic variants of nNOS have been reported in RLS patients (34). Although no functional consequences of these mutations have been identified to date, our results suggest that there may be a relationship between mitochondrial density and nNOS mutations.
The specificity of the role of the nigro-striatal pathway has been challenged in RLS pathogenesis (35). One possible area of involvement is A11, the source of the neurons for the descending dopaminergic pathway into the spinal cord (36); however, a recent autopsy study found no change in the volume of tyrosine hydroxylase neurons or gliosis in this region in RLS compared to controls (37). A potential explanation for selective involvement of one dopaminergic pathway over another is that mitochondrial size and number are not consistent between dopaminergic cell populations; for example, SN dopaminergic cells have fewer and smaller mitochondria than those in the neighboring ventral tegmental area (A10) (38). There are over 100 genes that differ in expression level between these 2 dopaminergic cell populations, and genes for metabolism and mitochondrial proteins are substantially elevated in the SN pars compacta compared to the ventral tegmental area (39). The increases in mitochondrial proteins and metabolism strongly suggest that nigral dopaminergic neurons have a higher metabolic rate than other dopaminergic cells. This latter concept is generally offered as the reason why the SN is more sensitive to the mitochondria-damaging agents paraquat, maneb, MPTP, and rotenone (40-44). Induction of mitochondriogenesis in the neuromelanin-containing cells through physiological responses or genetic variation may result in inadequate iron reserves to meet physiological challenges such as diurnal variation in iron availability or other conditions (e.g. pregnancy, anemia, renal dialysis) associated with RLS because of the high metabolic demands of this brain region. The concept that the SN is particularly sensitive to changes in iron status may be consistent with the relatively high levels of iron in this brain region. Iron increase into the SN has long been considered part of the pathological process for diseases involving the SN although this role of iron in the SN and particularly neuromelanin-containing cells has been questioned (45).
In conclusion, the present data indicate that FtMt levels and mitochondrial numbers are increased in the SN in RLS. The augmentation in mitochondria may reflect cellular attempts to correct metabolic insufficiency in these cells, which in turn may lead to cytosolic iron deficiency.
Acknowledgments
The authors wish to thank Giorgio Biasiotto, PhD (University of Brescia) for providing reagents used this study. For the maintenance and use of the densitometry equipment, the authors acknowledge Anne Stanley of the Macromolecular Core Facility of the Section of Research Resources, Penn State College of Medicine. The authors would also like to express sincere thanks to the patients and their families that made tissue donation possible and to the Harvard Brain Tissue Resource Center for maintenance and distribution of these samples.
This work was supported by a Program Project Grant from the NIH (1 P01 AG021190) awarded to the group studying pathophysiology of RLS (CJE) and by Telethon Italy to P. Arosio and S. Levi (GGP05141). The Harvard Brain Tissue Resource Center is supported by a federal grant (R24 MH068855-06).
References
- 1.Hening W, Walters AS, Allen RP, et al. Impact, diagnosis and treatment of restless legs syndrome (RLS) in a primary care population: The REST (RLS epidemiology, symptoms, and treatment) primary care study. Sleep Med. 2004;5:237–46. doi: 10.1016/j.sleep.2004.03.006. [DOI] [PubMed] [Google Scholar]
- 2.Rothdach AJ, Trenkwalder C, Haberstock J, et al. Prevalence and risk factors of RLS in an elderly population: The MEMO study. Memory and morbidity in Augsburg elderly. Neurology. 2000;54:1064–68. doi: 10.1212/wnl.54.5.1064. [DOI] [PubMed] [Google Scholar]
- 3.Allen RP, Picchietti D, Hening WA, et al. Restless legs syndrome: diagnostic criteria, special considerations, and epidemiology. A report from the restless legs syndrome diagnosis and epidemiology workshop at the National Institutes of Health. Sleep Med. 2003;4:101–19. doi: 10.1016/s1389-9457(03)00010-8. [DOI] [PubMed] [Google Scholar]
- 4.Schmidauer C, Sojer M, Seppi K, et al. Transcranial ultrasound shows nigral hypoechogenicity in restless legs syndrome. Ann Neurol. 2005;58:630–34. doi: 10.1002/ana.20572. [DOI] [PubMed] [Google Scholar]
- 5.Allen RP, Barker PB, Wehrl F, et al. MRI measurement of brain iron in patients with restless legs syndrome. Neurology. 2001;56:263–65. doi: 10.1212/wnl.56.2.263. [DOI] [PubMed] [Google Scholar]
- 6.Godau J, Schweitzer KJ, Liepelt I, et al. Substantia nigra hypoechogenicity: Definition and findings in restless legs syndrome. Mov Disord. 2006;22:187–92. doi: 10.1002/mds.21230. [DOI] [PubMed] [Google Scholar]
- 7.Earley CJ, Allen RP, Beard JL, et al. Insight into the pathophysiology of restless legs syndrome. J Neurosci Res. 2000;62:623–28. doi: 10.1002/1097-4547(20001201)62:5<623::AID-JNR1>3.0.CO;2-H. [DOI] [PubMed] [Google Scholar]
- 8.Connor JR, Boyer PJ, Menzies SL, et al. Neuropathological examination suggests impaired brain iron acquisition in restless legs syndrome. Neurology. 2003;61:304–9. doi: 10.1212/01.wnl.0000078887.16593.12. [DOI] [PubMed] [Google Scholar]
- 9.Mizuno S, Mihara T, Miyaoka T, et al. CSF iron, ferritin and transferrin levels in restless legs syndrome. J Sleep Res. 2005;14:43–47. doi: 10.1111/j.1365-2869.2004.00403.x. [DOI] [PubMed] [Google Scholar]
- 10.Connor JR, Wang XS, Patton SM, et al. Decreased transferrin receptor expression by neuromelanin cells in restless legs syndrome. Neurology. 2004;62:1563–67. doi: 10.1212/01.wnl.0000123251.60485.ac. [DOI] [PubMed] [Google Scholar]
- 11.Eisenstein RS. Iron regulatory proteins and the molecular control of mammalian iron metabolism. Annu Rev Nutr. 2000;20:627–62. doi: 10.1146/annurev.nutr.20.1.627. [DOI] [PubMed] [Google Scholar]
- 12.Lin E, Graziano JH, Freyer GA. Regulation of the 75-kDa subunit of mitochondrial complex I by iron. J Biol Chem. 2001;276:27685–92. doi: 10.1074/jbc.M100941200. [DOI] [PubMed] [Google Scholar]
- 13.Melefors O. Translational regulation in vivo of the Drosophila melanogaster mRNA encoding succinate dehydrogenase iron protein via iron responsive elements. Biochem Biophys Res Commun. 1996;221:437–41. doi: 10.1006/bbrc.1996.0613. [DOI] [PubMed] [Google Scholar]
- 14.Napier I, Ponka P, Richardson DR. Iron trafficking in the mitochondrion: Novel pathways revealed by disease. Blood. 2005;105:1867–74. doi: 10.1182/blood-2004-10-3856. [DOI] [PubMed] [Google Scholar]
- 15.Paradkar PN, Zumbrennen KB, Paw BH, et al. Regulation of mitochondrial iron import through differential turnover of mitoferrin 1 and mitoferrin 2. Mol Cell Biol. 2009;29:1007–16. doi: 10.1128/MCB.01685-08. [DOI] [PMC free article] [PubMed] [Google Scholar]
- 16.Lin MT, Beal MF. Mitochondrial dysfunction and oxidative stress in neurodegenerative diseases. Nature. 2006;443:787–95. doi: 10.1038/nature05292. [DOI] [PubMed] [Google Scholar]
- 17.Levi S, Corsi B, Bosisio M, et al. A human mitochondrial ferritin encoded by an intronless gene. J Biol Chem. 2001;276:24437–40. doi: 10.1074/jbc.C100141200. [DOI] [PubMed] [Google Scholar]
- 18.Drysdale J, Arosio P, Invernizzi R, et al. Mitochondrial ferritin: A new player in iron metabolism. Blood Cells Mol Dis. 2002;29:376–83. doi: 10.1006/bcmd.2002.0577. [DOI] [PubMed] [Google Scholar]
- 19.Levi S, Arosio P. Mitochondrial Ferritin. Internat J Biochem Cell Bio. 2004;36:1887–89. doi: 10.1016/j.biocel.2003.10.020. [DOI] [PubMed] [Google Scholar]
- 20.Campanella A, Isaya G, O’Neill HA, et al. The expression of human mitochondrial ferritin rescues respiratory function in frataxin-deficient yeast. Hum Mol Genet. 2004;13:2279–88. doi: 10.1093/hmg/ddh232. [DOI] [PubMed] [Google Scholar]
- 21.Campanella A, Rovelli E, Santambrogio P, et al. Mitochondrial ferritin limits oxidative damage regulating mitochondrial iron availability: Hypothesis for a protective role in Friedreich ataxia. Hum Mol Genet. 2009;18:1–11. doi: 10.1093/hmg/ddn308. [DOI] [PMC free article] [PubMed] [Google Scholar]
- 22.Corsi B, Cozzi A, Arosio P, et al. Human mitochondrial ferritin expressed in HeLa cells incorporates iron and affects cellular iron metabolism. J Biol Chem. 2002;277:22430–37. doi: 10.1074/jbc.M105372200. [DOI] [PubMed] [Google Scholar]
- 23.Elleder M, Borovansky J. Autofluorescence of melanins induced by ultraviolet radiation and near ultraviolet light. A histochemical and biochemical study. Histochem J. 2001;33:273–81. doi: 10.1023/a:1017925023408. [DOI] [PubMed] [Google Scholar]
- 24.Cavanna F, Ruggeri G, Iacobello C, et al. Development of a monoclonal antibody against human heart ferritin and its application in an immunoradiometric assay. Clin Chim Acta. 1983;134:347–56. doi: 10.1016/0009-8981(83)90373-x. [DOI] [PubMed] [Google Scholar]
- 25.Gutsaeva DR, Carraway MS, Suliman HB, et al. Transient hypoxia stimulates mitochondrial biogenesis in brain subcortex by a neuronal nitric oxide synthase-dependent mechanism. J Neurosci. 2008;28:2015–24. doi: 10.1523/JNEUROSCI.5654-07.2008. [DOI] [PMC free article] [PubMed] [Google Scholar]
- 26.Hausmann A, Samans B, Lill R, et al. Cellular and mitochondrial remodeling upon defects in iron-sulfur protein biogenesis. J Biol Chem. 2008;283:8318–30. doi: 10.1074/jbc.M705570200. [DOI] [PubMed] [Google Scholar]
- 27.Chou YF, Yu CC, Huang RF. Changes in mitochondrial DNA deletion, content, and biogenesis in folate-deficient tissues of young rats depend on mitochondrial folate and oxidative DNA injuries. J Nutr. 2007;137:2036–42. doi: 10.1093/jn/137.9.2036. [DOI] [PubMed] [Google Scholar]
- 28.Gutsaeva DR, Suliman HB, Carraway MS, et al. Oxygen-induced mitochondrial biogenesis in the rat hippocampus. Neuroscience. 2006;137:493–504. doi: 10.1016/j.neuroscience.2005.07.061. [DOI] [PubMed] [Google Scholar]
- 29.Mattingly KA, Ivanova MM, Riggs KA, et al. Estradiol stimulates transcription of nuclear respiratory factor-1 and increases mitochondrial biogenesis. Mol Endocrinol. 2008;22:609–22. doi: 10.1210/me.2007-0029. [DOI] [PMC free article] [PubMed] [Google Scholar]
- 30.Rangwala SM, Li X, Lindsley L, et al. Estrogen-related receptor alpha is essential for the expression of antioxidant protection genes and mitochondrial function. Biochem Biophys Res Commun. 2007;357:231–36. doi: 10.1016/j.bbrc.2007.03.126. [DOI] [PubMed] [Google Scholar]
- 31.Gutsaeva DR, Carraway MS, Suliman HB, et al. Transient hypoxia stimulates mitochondrial biogenesis in brain subcortex by a neuronal nitric oxide synthase-dependent mechanism. J Neurosci. 2008;28:2015–24. doi: 10.1523/JNEUROSCI.5654-07.2008. [DOI] [PMC free article] [PubMed] [Google Scholar]
- 32.Patton SM, Ponnuru P, Connor JR. Upregulation of HIF-1a and nNOS in patients with RLS. Society for Neuroscience Meeting; Washington Convention Center, Washington, D.C. 2008. [Google Scholar]
- 33.Yin W, Signore AP, Iwai M, et al. Rapidly increased neuronal mitochondrial biogenesis after hypoxic-ischemic brain injury. Stroke. 2008;39:3057–63. doi: 10.1161/STROKEAHA.108.520114. [DOI] [PMC free article] [PubMed] [Google Scholar]
- 34.Winkelmann J, Lichtner P, Schormair B, et al. Variants in the neuronal nitric oxide synthase (nNOS, NOS1) gene are associated with restless legs syndrome. Mov Disord. 2008;23:350–58. doi: 10.1002/mds.21647. [DOI] [PubMed] [Google Scholar]
- 35.Clemens S, Rye D, Hochman S. Restless legs syndrome: Revisiting the dopamine hypothesis from the spinal cord perspective. Neurology. 2006;67:125–30. doi: 10.1212/01.wnl.0000223316.53428.c9. [DOI] [PubMed] [Google Scholar]
- 36.Qu S, Le W, Zhang X, et al. Locomotion is increased in a11-lesioned mice with iron deprivation: a possible animal model for restless legs syndrome. J Neuropathol Exp Neurol. 2007;66:383–88. doi: 10.1097/nen.0b013e3180517b5f. [DOI] [PubMed] [Google Scholar]
- 37.Earley CJ, Allen RP, Connor JR, et al. The Dopaminergic Neurons of the A11 system in RLS Autopsy Brains Appear Normal. Sleep Med. 2009 March 21; doi: 10.1016/j.sleep.2009.01.006. Epub ahead of print. [DOI] [PMC free article] [PubMed] [Google Scholar]
- 38.Liang CL, Wang TT, Luby-Phelps K, et al. Mitochondria mass is low in mouse substantia nigra dopamine neurons: Implications for Parkinson’s disease. Exp Neurol. 2007;203:370–80. doi: 10.1016/j.expneurol.2006.08.015. [DOI] [PubMed] [Google Scholar]
- 39.Chung CY, Seo H, Sonntag KC, et al. Cell type-specific gene expression of midbrain dopaminergic neurons reveals molecules involved in their vulnerability and protection. Hum Mol Genet. 2005;14:1709–25. doi: 10.1093/hmg/ddi178. [DOI] [PMC free article] [PubMed] [Google Scholar]
- 40.McCormack AL, Atienza JG, Langston JW, et al. Decreased susceptibility to oxidative stress underlies the resistance of specific dopaminergic cells populations to paraquat-induced degeneration. Neuroscience. 2006;141:929–37. doi: 10.1016/j.neuroscience.2006.03.069. [DOI] [PubMed] [Google Scholar]
- 41.Thiruchelvam M, Brockel BJ, Richfield EK, et al. Potentiated and preferential effects of combined paraquat and maneb on nigrostriatal dopamine systems: Environmental risk factors for Parkinson’s disease? Brain Res. 2000;873:225–34. doi: 10.1016/s0006-8993(00)02496-3. [DOI] [PubMed] [Google Scholar]
- 42.Thiruchelvam M, McCormack A, Richfield EK, et al. Age-related irreversible progressive nigrostriatal dopaminergic neurotoxicity in the paraquat and maneb model of the Parkinson’s disease phenotype. Eur J Neuroscience. 2003;18:589–600. doi: 10.1046/j.1460-9568.2003.02781.x. [DOI] [PubMed] [Google Scholar]
- 43.Thiruchelvam M, Richfield EK, Baggs RB, et al. The nigrostriatal dopaminergic system as a preferential target of repeated exposures to combined paraquat and maneb: Implications for Parkinson’s disease. J Neuroscience. 2000;20:9207–14. doi: 10.1523/JNEUROSCI.20-24-09207.2000. [DOI] [PMC free article] [PubMed] [Google Scholar]
- 44.Uversky VN. Neurotoxicant-induced animal models of Parkinson’s disease: Understanding the role of rotenone, maneb and paraquat in neurodegeneration. Cell Tiss Res. 2004;318:225–41. doi: 10.1007/s00441-004-0937-z. [DOI] [PubMed] [Google Scholar]
- 45.Snyder AM, Connor JR. Iron, the substantia nigra and related neurological disorders. Biochim Biophys Acta. 2009;1790:606–14. doi: 10.1016/j.bbagen.2008.08.005. [DOI] [PubMed] [Google Scholar]


