
Figure 6. Development is coordinated locally among small clusters of cells.
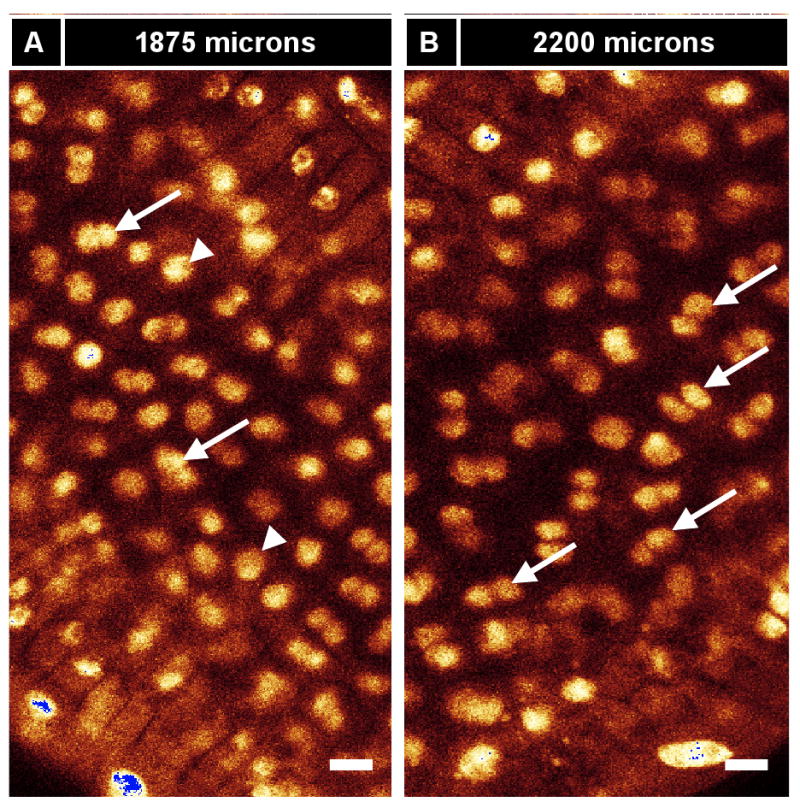
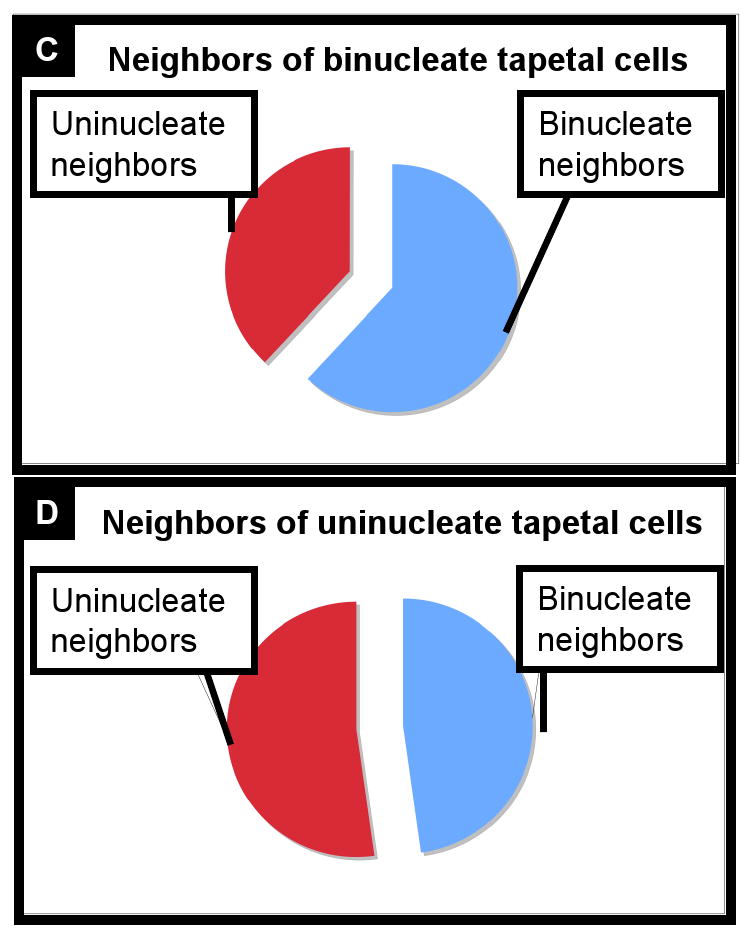
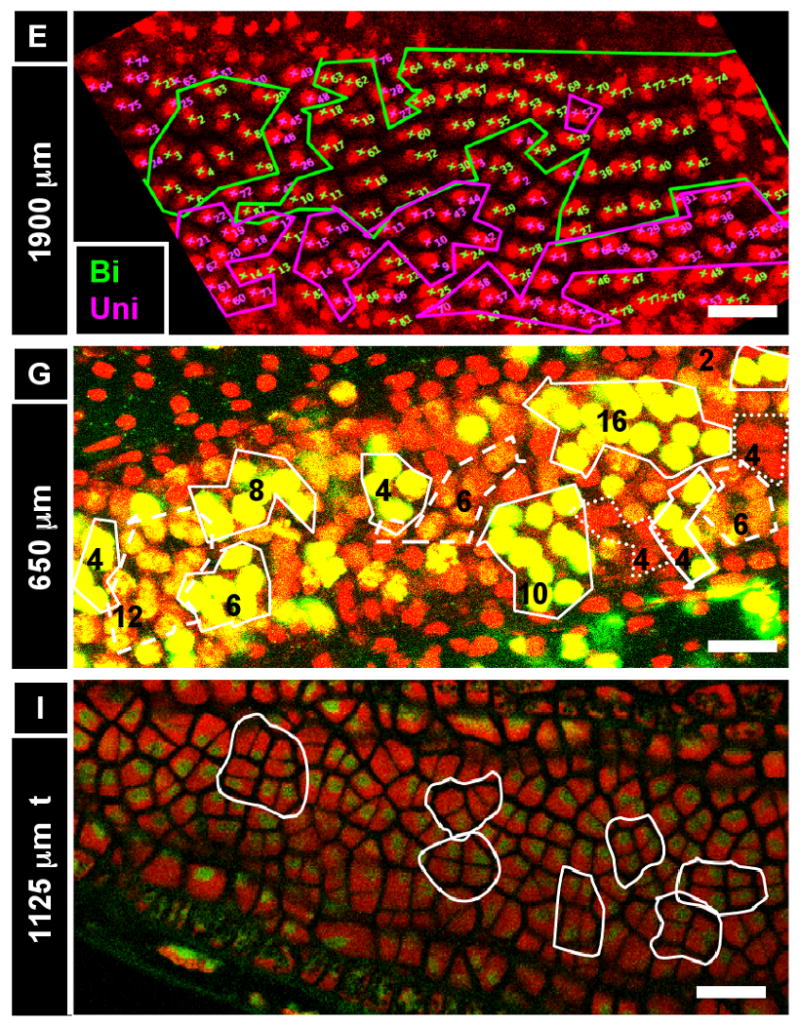
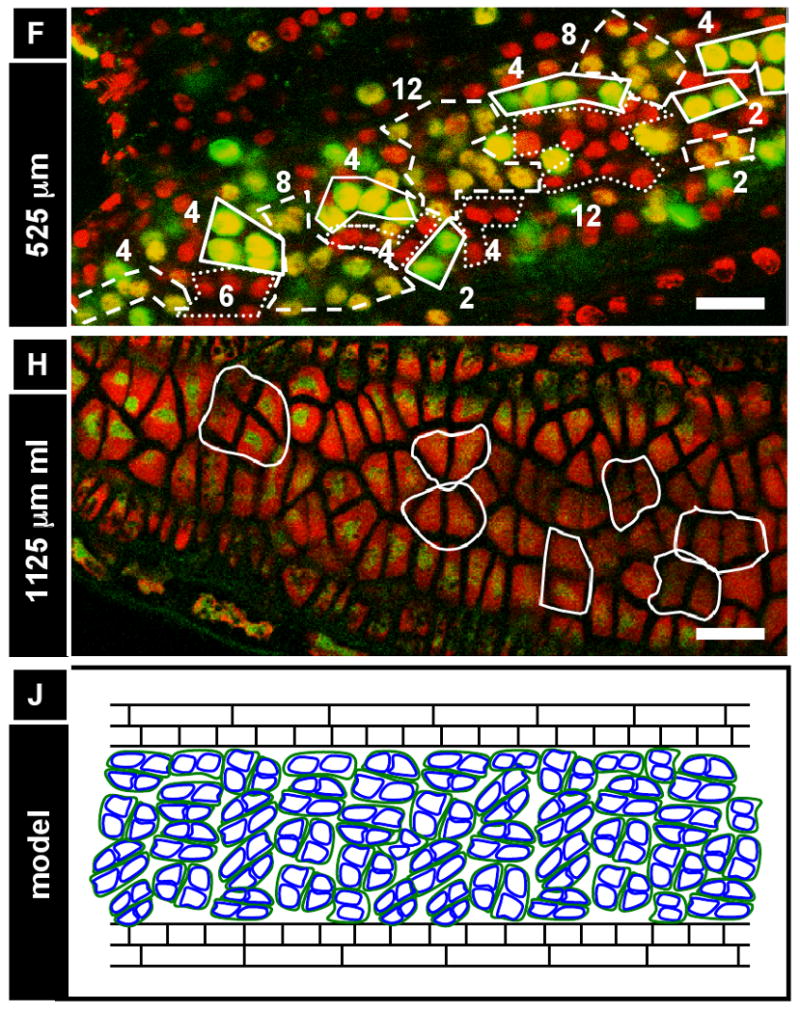
(A, B) Tapetum binucleation is gradual (arrows, binucleate tapetum cells; arrowheads, uninucleate tapetum cells). (A) An 1800 μm anther in optical section with a partially binucleate tapetum. (B) An older anther (2200 μm) from the same individual with a fully binucleate tapetum (arrows; although some cells appear uninucleate, they are truly binucleate, with the second nucleus being out of the optical plane). (C-E) Tapetum binucleation exhibits clustering. In this experiment, three anthers that had about half of their tapetum cells binucleate (average ∼53% binucleate) were analyzed. For each binucleate and uninucleate cell, neighbors were categorized as binucleate or uninucleate (total: 87 cells) (C) Binucleate cells are more likely to have binucleate neighbors and (D) uninucleate cells are more likely to have uninucleate neighbors. (E) A representative anther from C and D. Tapetum binucleation exhibits clustering (pink, uninucleate cells; green, binucleate cells). (F, G) Anthers from a 48 hr EdU in planta incorporation (12 injections, 4 hours apart) displayed clustering. Numbers indicate the number of cells circled in a given “clone”. [Solid circles, brightest cells (recent and/or repeated EdU incorporation); dashed circles, cells of medium brightness (one or more divisions away from most recent EdU incorporation); dotted circles, cells with no EdU staining visible (dropouts or slowly cycling).] (H-J) Middle layer and tapetum cells exhibit clustering. (H) Groups of two or four middle layer cells are outlined in an 1125 μm anther. (I) In the same anther, the same outlines perfectly overlay groups of four or eight tapetum cells. From this image, it appears that new cell walls build during anticlinal divisions of the middle layer and tapetum are continuous, and that the tapetum at this stage is exactly one round of division ahead of the middle layer. We hypothesize that these groups of 2, 4, or 8 middle layer and tapetum cells all share a common, single spl precursor, and that each spl cell functions as a developmental unit. (J) Model of middle layer and tapetum clustering showing the overlap of H and I. Scale bars: (A,B) = 10 μm; (E-I) = 25 μm.