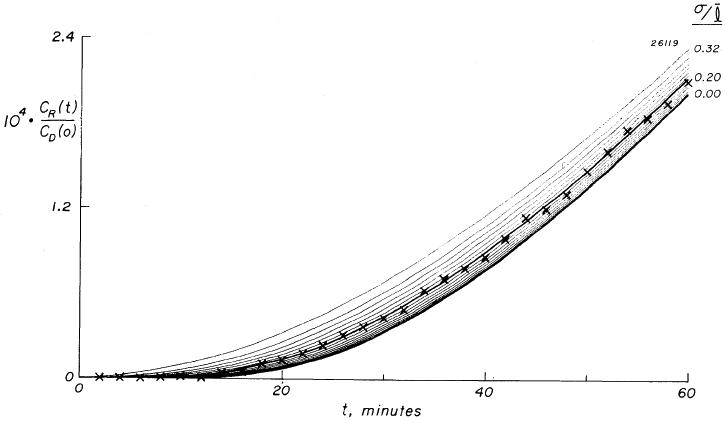
FIG. 6.

Transient phase of normalized accumulation, ×, of sucrose-14C in a sheet of mean thickness, l = 1.48 mm (SD, σ = 0.14 mm). Continuous curves are a family calculated from multiple-pathway model. Each curve represents a single Gaussian distribution of path lengths characterized by its relative dispersion (σ/l). Seventeen curves are shown with σ/l varying between 0.00 and 0.32. Curves differ only in transient portion and are superimposed at steady state, a σ/l of 0.20 providing best fit to data.
