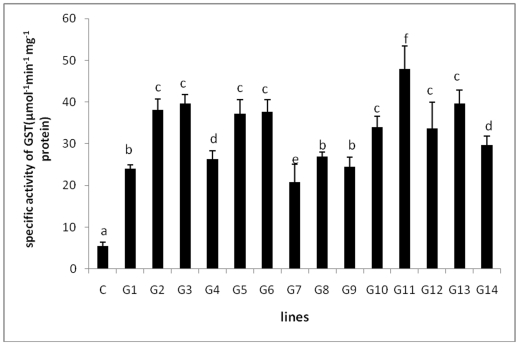
Figure 2. Enzymatic assay for GST using transgenic and control tobacco plants.
C-control plant, G1-G14 transgenic plants showing different levels of expression of GST enzyme. G11 transgenic line showed the maximum (∼6 fold) expression of GST as compared to control plants. Different letters indicate significantly different values at p≤0.05 by Duncan's test.

