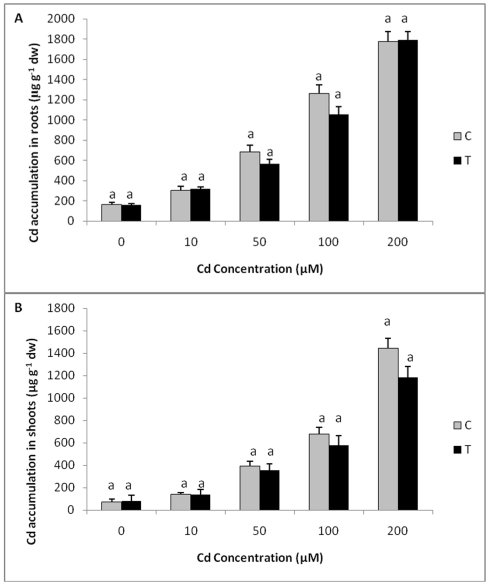
Figure 10. Cd accumulation in transgenic and control plants exposed to different concentrations of Cd.
A Cd accumulation in roots of transgenic (T0) and control plants exposed to different concentrations of Cd. B Cd accumulation in shoots of transgenic and wild type plants exposed to different Cd concentrations. All values are means of three replicates. Different letters indicate significantly different values at p≤0.05.

