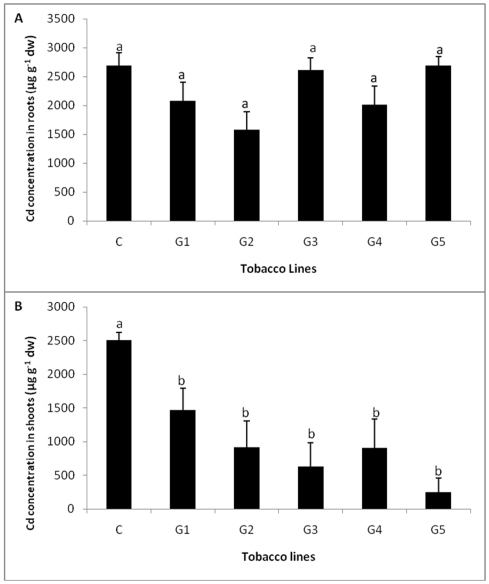
Figure 11. Cd accumulation in T1 transgenic and control plants exposed to different concentrations of Cd.
A Cd accumulation in roots of five independent T1 transgenic and control plants exposed to 200 µM concentrations of Cd. B Cd accumulation in shoots of five independent T1 transgenic and control plants exposed to 200 µM concentrations of Cd. All values are means of three replicates. Different letters indicate significantly different values at p≤0.05.

