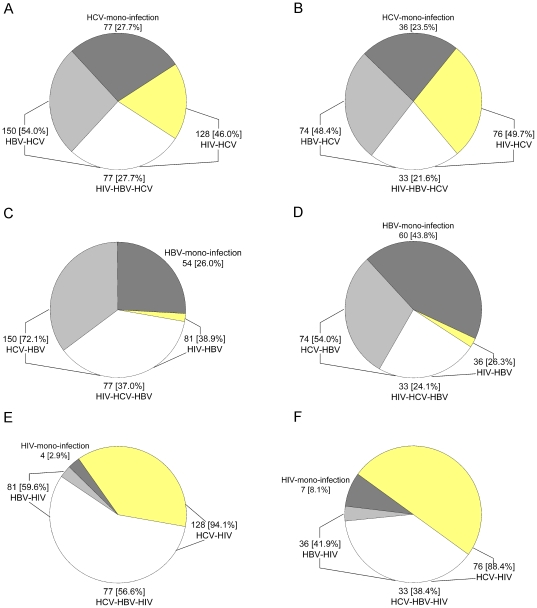
Figure 3. Proportion with mono-infection or co-infection among all HCV, HBV or HIV infected IDUs from China or Myanmar.
proportion with HCV mono-infection, HBV-HCV co-infection, HIV-HCV co-infection and HIV-HBV-HCV triple infection among all Chinese (A) or Burmese (B) HCV infected IDUs; proportion with HBV mono-infection, HCV-HBV co-infection, HIV-HBV co-infection and HIV-HCV-HBV triple infection among all Chinese (C) or Burmese (D) HBV infected IDUs; proportion with HIV mono-infection, HCV-HIV co-infection, HBV-HIV co-infection and HCV-HBV-HIV triple infection among all Chinese (E) or Burmese (F) HIV infected IDUs.

