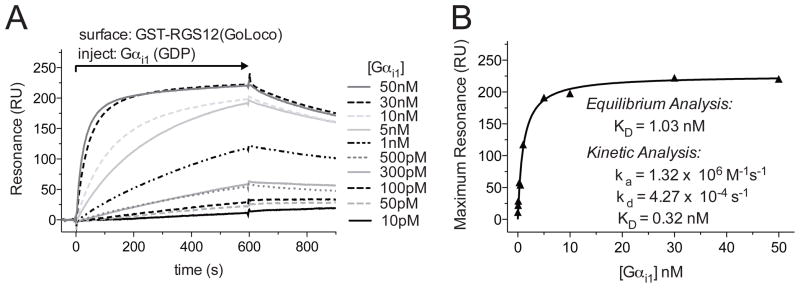
Figure 2. Affinity and kinetic measurements using an anti-GST antibody CM5 sensor chip.
A. Flow cells 1 and 2 were loaded with 1000 RUs of GST and GST-RGS12GoLoco proteins, respectively. Increasing concentrations of Gαi1 were injected using the KINJECT command (300 μl injections with a 200 second dissociation phase at 20 μl/min flow rate). Specific binding was determined by subtracting non-specific binding to a GST control flow cell from the GST-RGS12GoLoco response curve. B. Binding affinities were determined by plotting the maximum response attained at each concentration of Gαi1 versus the concentration of the Gαi1, then by fitting to a Langmuir binding isotherm using GraphPad Prism 5.0 (GraphPad Software, La Jolla, CA) to determine dissociation constant (KD). Kinetic analyses of the association (ka) and dissociation (kd) rates were also used to determine KD using the simultaneous ka/kd (1:1 Langmuir) model (BIAevaluation). Differences in KD determinations between kinetic and equilibrium analyses are likely to reflect mass-transport and/or rebinding limitations to binding assay execution, as indicated by large ka values, nearly linear initial association seen on sensorgrams, and/or greatly slowed dissociation (see Schuck, P. et al. in this Volume for further information).

