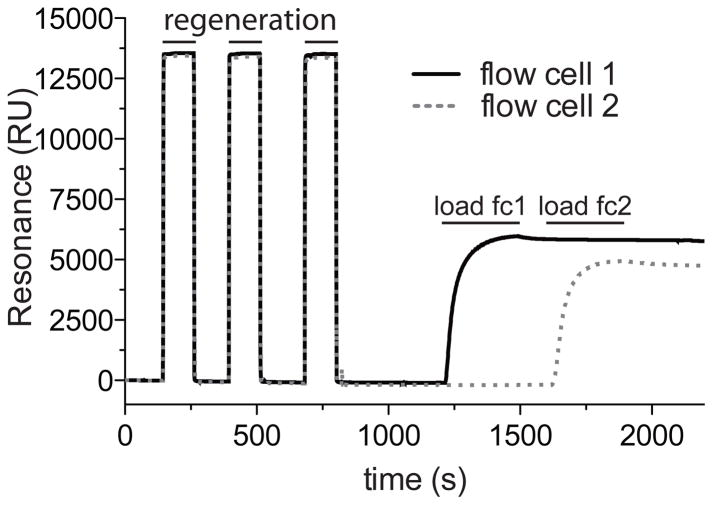
Figure 5. Loading Streptavidin (SA) Sensor Chip.
A typical sensorgram generated during the loading of biotinylated protein to flow cells 1 and 2. The flow cell surface was stabilized with 3 × 20 μl injections of Regeneration Buffer before loading of biotinylated-Gαi1 (260 nM final concentration, as diluted in Biotin-conjugate Immobilization Buffer), one flow cell at a time, until saturation is observed (note plateau in sensorgram curves).

