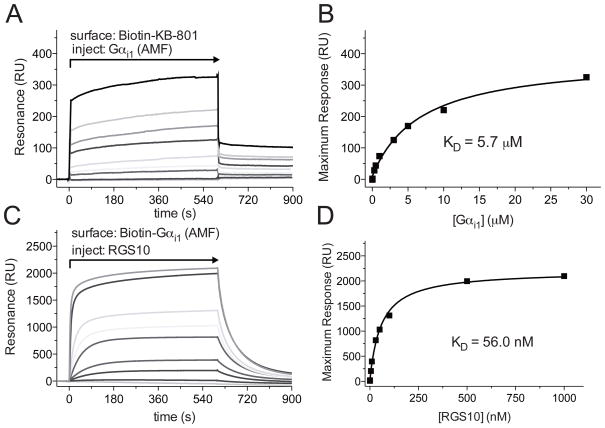
Figure 6. Affinity measurements using a SA sensor chip.
A. Flow cell 1 was loaded with 450 RUs of Biotin-KB-801 peptide, and flow cell 2 was loaded with 350 RUs mNotch peptide as a control. Increasing concentrations of Gαi1 in GDP+Mg2++AlF4− (AMF) Buffer, the transition state mimetic form, were injected over the sensor surface as indicated, using the KINJECT command (300 μl injections with a 200 second dissociation phase at 20 μl/min flow rate). Binding curves were obtained by subtracting non-specific binding to a non-interacting biotinylated peptide from all experiment-containing flow cells. B. Binding affinities were determined by plotting the maximum response attained at each concentration of Gαi1 versus the concentration of the Gαi1, then by fitting to a rectangular hyperbola to determine KD using GraphPad Prism 5.0 (Graphpad Software, La Jolla, CA). C. Flow cell 1 was loaded with 450 RUs of Biotin-Gαi1, and flow cell 2 was loaded with an equivalent RU signal of denatured Biotin-Gαi1. Varying concentrations of RGS10 in GDP+Mg2++AlF4− (AMF) Buffer were injected over the sensor surface as indicated, using the KINJECT command (300 μl injections with a 200 second dissociation phase at 20 μl/min flow rate). Specific binding was determined by subtracting non-specific binding from a flow cell containing denatured biotin-Gαi1. D. Binding affinities were determined by plotting the maximum response attained at each concentration of RGS10 versus the concentration of the RGS10, then by fitting to a rectangular hyperbola to determine KD using GraphPad Prism 5.0 (GraphPad Software, La Jolla, CA). These final panels were reproduced from Soundararajan et al. 2008 (ref. (7)). Copyright (c) 2008 National Academy of Sciences, U.S.A.

