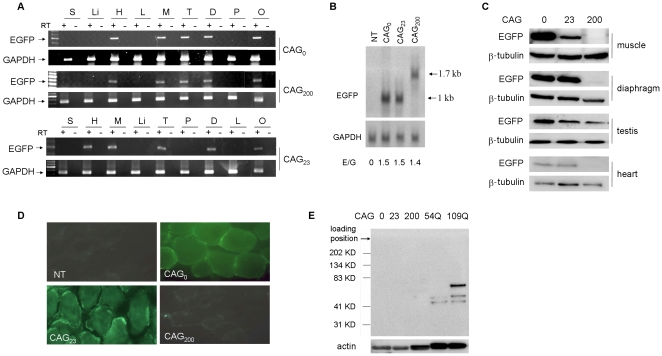
Figure 2. Transgene expression.
(A) RT-PCR of RNA isolated from different adult tissues. Representative gels showing expression of EGFP in CAG0, CAG23 and CAG200 lines. Amplification of GAPDH was used as an internal control. +, with RT; −, without RT. S, skin; Li, liver; H, heart; L, lung; M, muscle (soleus); T, testis; D, diaphragm; P, pancreas; O, ovary. (B) Northern blot analysis. Representative blot showing skeletal muscle RNA from non-transgenic (NT), CAG0, CAG23 and CAG200 animals hybridized with an EGFP probe or a control GAPDH probe. Relative RNA expression levels (E/G, EGFP divided by GAPDH) are shown below. (C) EGFP protein expression in the transgenic lines determined by western blotting using an anti-EGFP antibody. H, heart; M, muscle; D, diaphragm. Expression of β-tubulin was used as a loading control. (D) EGFP fluorescence was observed using frozen sections from the soleus muscle with a fluorescence microscope. Reduced fluorescence in CAG200 muscle is consistent with the reduced protein expression shown in (C). (E) Detection of polyglutamine-containing protein with a mouse anti-polyglutamine monoclonal antibody (1C2). Protein extracts from the muscle of three mouse lines (50 µg each) and two cell lines transfected with expanded ataxin-3 proteins (54Q, 109Q) (12.5 µg each) were used. Arrowheads indicate the endogenous (45 Kd) and mutant ataxin-3 proteins with 54 or 109 CAG repeats. The position of the wells is indicated to verify the absence of insoluble 1C2-positive proteins. Actin expression was used as a control.

