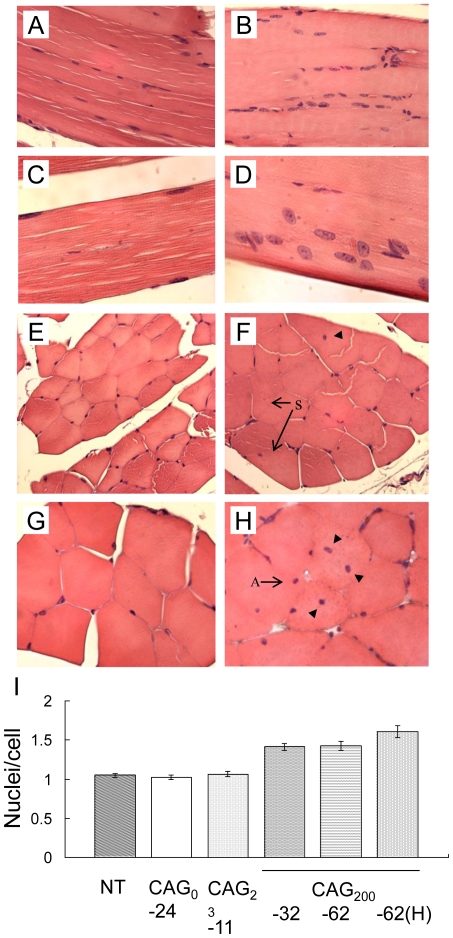
Figure 3. Muscle morphology.
Hematoxylin and eosin-stained paraffin sections of soleus muscle oriented as longitudinal (A–D) or transverse sections (E–H) from 2-month-old non-transgenic (A, E), CAG0 (C), CAG23 (G), and CAG200 (B, D, F, H) animals. Note that the fiber diameters in CAG200 mice (B) are not as uniform as in the control (A) and that multiple rounded nuclei are observed (D). Some nuclei are located internally (arrowheads, F, H) instead of peripherally (C, E, G), and there are signs of split fibers (arrows in F) and angular fibers (arrow in H). (I) Quantification of nuclei (expressed as the nuclei-to-cell ratio). Nuclei and cells in 10 fields in each of four sections from each transgenic line (NT, CAG0-24, CAG23-11, CAG200-32, -62 and one homozygous mouse) were counted using 400× magnification; the average values are presented. *P<0.001. (A–B), 200×; (C–D), 400×; (E–F), 250×; (G–H), 400×.

