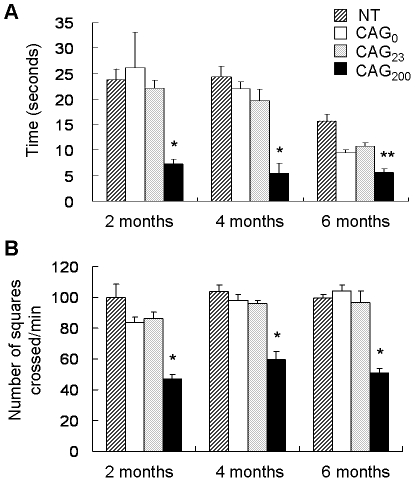
Figure 5. Phenotypic analysis of transgenic mice.
(A) Grip strength test. Mice were suspended by the forelimbs on a narrow bar and the amount of time before falling was recorded. (B) Cage activity test. CAG200 lines displayed reduced locomotion activity as measured by a grid assay. All data represent the averages from 5 mice that were each tested 3 times (A and B). *, P<0.001; **, P<0.01 (compared to NT, CAG0, or CAG23; F test).

