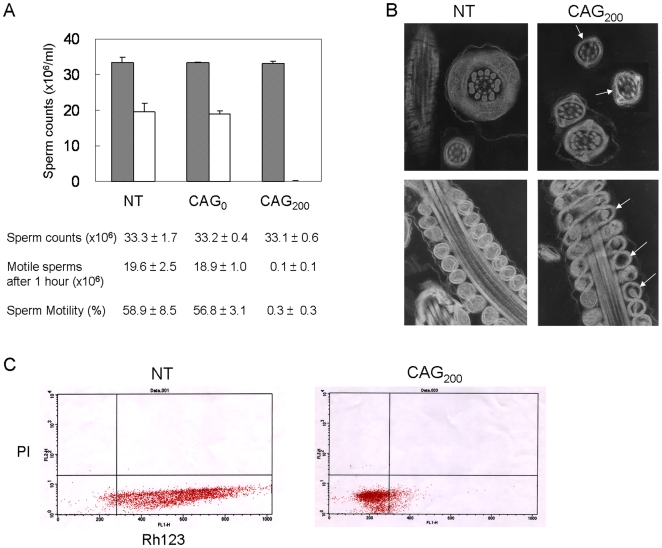
Figure 6. Sperm motility and mitochondrial function.
(A) Counts of total sperm (gray) and motile sperm (white) after a 1-hr incubation at 37°C (n = 6 per group). The average counts are shown below the histogram. Percent sperm motility was determined by dividing the number of motile sperm by total sperm counts. (B) Structure of the sperm tails. Electron microscopy revealed structural defects in the microtubule arrangement of axonemes (loss of one outer doublet; upper right panel, arrows) and in the mitochondria along the midpiece (lower right panel, arrows) in some sperm tails of CAG200 mice. (C) Flow cytometric sorting of rhodamine (Rh123)- and propidium iodide (PI)-stained sperm cells. Horizontal scale, intensity of Rh123; vertical scale, intensity of PI. Note that most sperm cells from CAG200 males are gated with low PI and low Rh123 fluorescence, indicating that they are viable, but have low mitochondrial activity.

