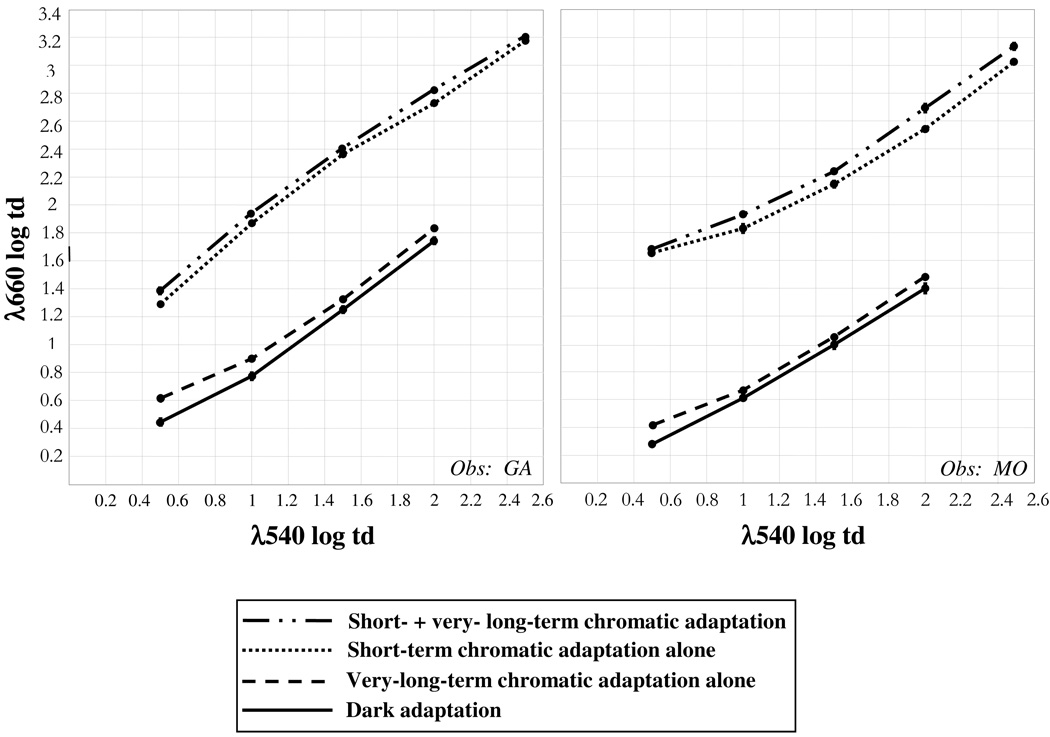
Figure 3.
Average measurements of equilibrium yellow during the baseline and very-long-term chromatic adaptation experimental periods. Baseline measurements: dark adaptation (solid line) and short-term chromatic adaptation alone (dotted line). Shifts in unique yellow due to introducing very-long-term adaptation: VLT adaptation alone (dashed line); VLT together with short-term adaptation (dash-dot line). The amount of 660 nm test light (vertical axis) needed to establish equilibrium yellow is given as a function of the amount of 540 nm test light (horizontal axis).

